Introduction
In the following sections, we will assess where we are today, 70 years after Brown v. Board of Education and 60 years after enactment of the Civil Rights Act of 1964, in terms of making progress toward ameliorating gaps in educational attainment, income and earnings, and unemployment—gaps that have historically favored White men and disadvantaged all other groups, including Black and Hispanic women and men and White women, as discussed in depth in Events and Policies Impacting the Economic Progress of Native Peoples, People of Color, Women, and LGBTQ+ Individuals.
As we will see in the sections that follow, while there has been substantial progress in reducing some of these gaps over the last four decades, many remain, and some have grown worse. What do researchers find that explains the education, earnings, and unemployment gaps that remain? Many of the factors boil down to these five categories:
- Sorting into certain types of jobs or job categories that offer lower pay/fewer benefits: For example, Black workers are overrepresented in fields where pensions, 401(k) plans, and other benefits are not the norm, which can be attributed to “discriminatory factors” and the institutional and structural racism outlined in Events and Policies Impacting the Economic Progress of Black Americans. They are underrepresented in professional occupations, where pay is 44 percent higher than in other occupations, and they rarely make it to the CEO level—just 3 percent of CEOs are Black. Black CEOs are more likely to work in government and nonprofit sectors and less likely to be in the private sector, where CEO earnings have seen such extraordinary increases over the last 40 years.
- Underemployment per workers’ credentials: Underemployment is not a phenomenon limited to Black and Latin(o/a/x) workers, but a 2019 study found that nearly 40 percent of Black college graduates and advanced degree holders were working jobs that don’t even require a college degree, compared to 31 percent of White workers.
- Unequal pay within same job or job category: Black and Latin(o/a/x) professional workers earn less than their White counterparts in similar jobs.
- Effects of mass incarceration: Black Americans are more likely than White Americans to be incarcerated after an arrest, and incarceration on one’s record serves as a major barrier to entry into the job market and impacts the kinds of jobs (and pay) available.
- Blatant discrimination in hiring: There has been and is still strong evidence of hiring discrimination affecting opportunities for Black workers and, to a lesser extent, Latin(o/a/x) workers:
- Marianne Bertrand and Sendhil Mullainathan’s "Are Emily and Greg More Employable Than Lakisha and Jamal? A Field Experiment on Labor Market Discrimination," published in 2004, found that—even when job applicants’ resumés were equal—having a White-sounding name got 50 percent more callbacks for job interviews than Black-sounding names.
- In 2017, a team of Harvard and Northwestern scholars examined 28 similar field experiments—in total these involved 55,000 applications submitted for more than 26,000 job positions—assessing trends in hiring discrimination against Black and Latin(o/a/x) job applicants over time. They reported “… no change in the levels of discrimination against African Americans since 1989, although we do find some indication of declining discrimination against Latinos. The results document a striking persistence of racial discrimination in US labor markets.” They found that White applicants were 36 percent more likely to get called for an interview than Black applicants and 24 percent more likely than Latin(o/a/x) applicants. The authors concluded, “Contrary to claims of declining discrimination in American society, our estimates suggest that levels of discrimination remain largely unchanged, at least at the point of hire.”
Educational Attainment
High School Completion
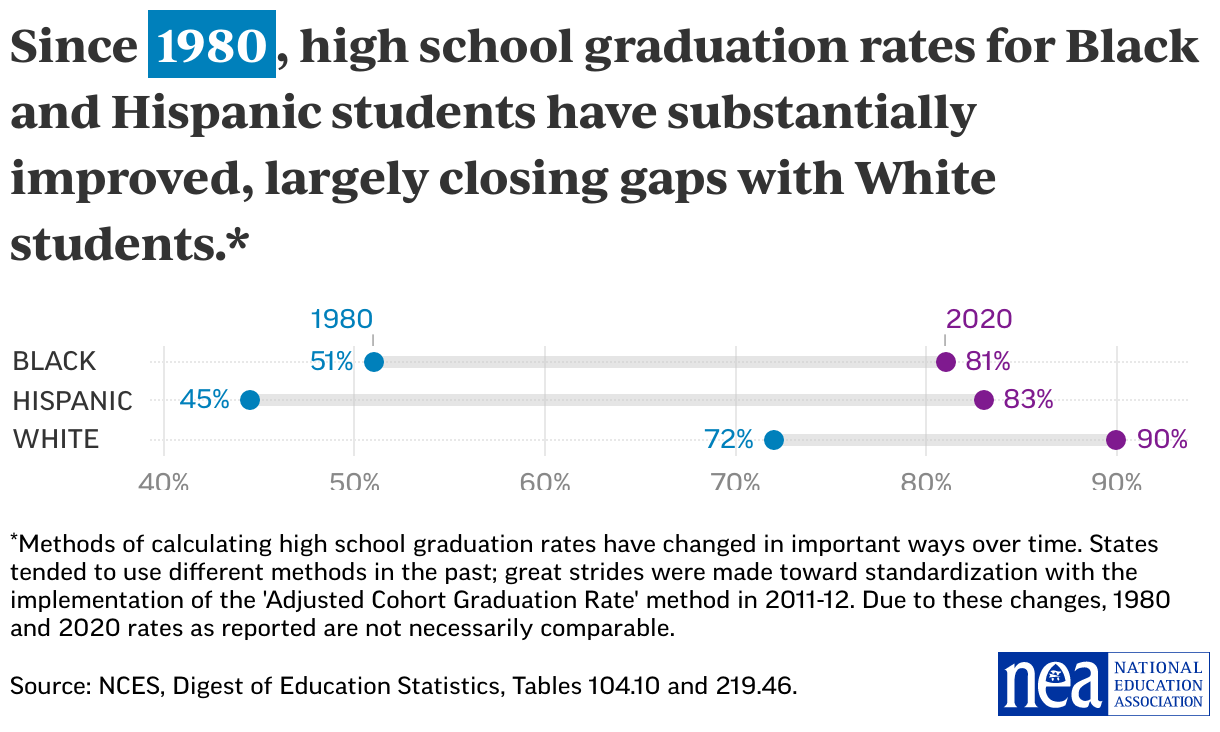
The gains in high school graduation rates between 1980 and 2020, especially for Black and White workers, were dramatic. As seen in the below chart, graduation rates went from roughly half of Black and Hispanic students and nearly three-quarters of White students in 1980, to 80 percent or more of Black and Hispanic students (30- and 38-percentage-point increases, respectively) and 90 percent of White students (an 18-percentage-point increase) in 2020.
Section with embed
Also, by 2020 graduation rates for female students had surpassed rates for male students. In 1980, high school graduation rates had been higher for women compared to men only among Black Americans; by 2020, however, women were graduating from high school at higher rates than men among White and Hispanic students as well as Black students. White women had a graduation rate in 2020 of 91 percent (the highest among these groups) while Hispanic men were graduating at a rate of 78 percent (the lowest rate).
College Attendance
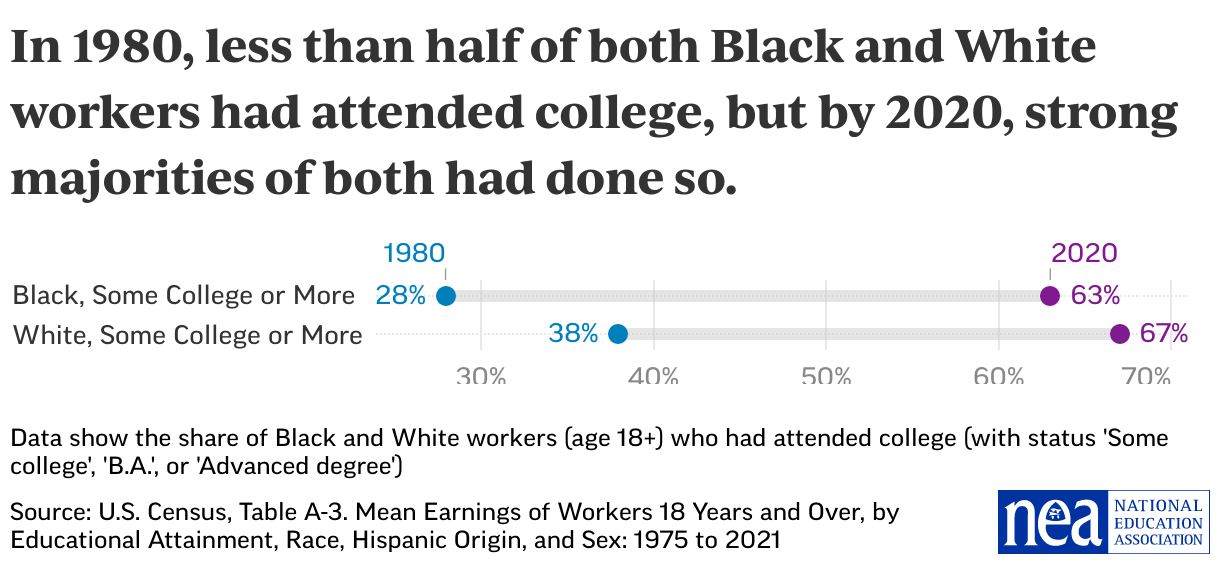
From 1980 to 2020, the proportion of Black Americans who attended at least some college more than doubled, while the proportion of White Americans who did so nearly doubled. By 2020, the share of Black Americans who had at least some college experience was nearly equal to that of White Americans.
There was a time, of course, when a high school diploma was all that was required by way of educational attainment to be able to find employment that offered a good chance of a middle-class lifestyle. Gradually, over the decades, that has changed. According to a study by Emily Hanford, while in 1970 “26 percent of middle-class workers had any kind of education beyond high school,” by 2018, “nearly 60 percent of all jobs in the U.S. economy require[d] higher education.”
In the below chart, we can see that the share of Black Americans who had attended some college (up to and including advanced degrees) was 10 percentage points lower than that of White Americans in 1980, but by 2020, the gap had narrowed to just 4 percentage points, from 67 percent to 63 percent.
Section with embed
Completion of at Least Four Years of College
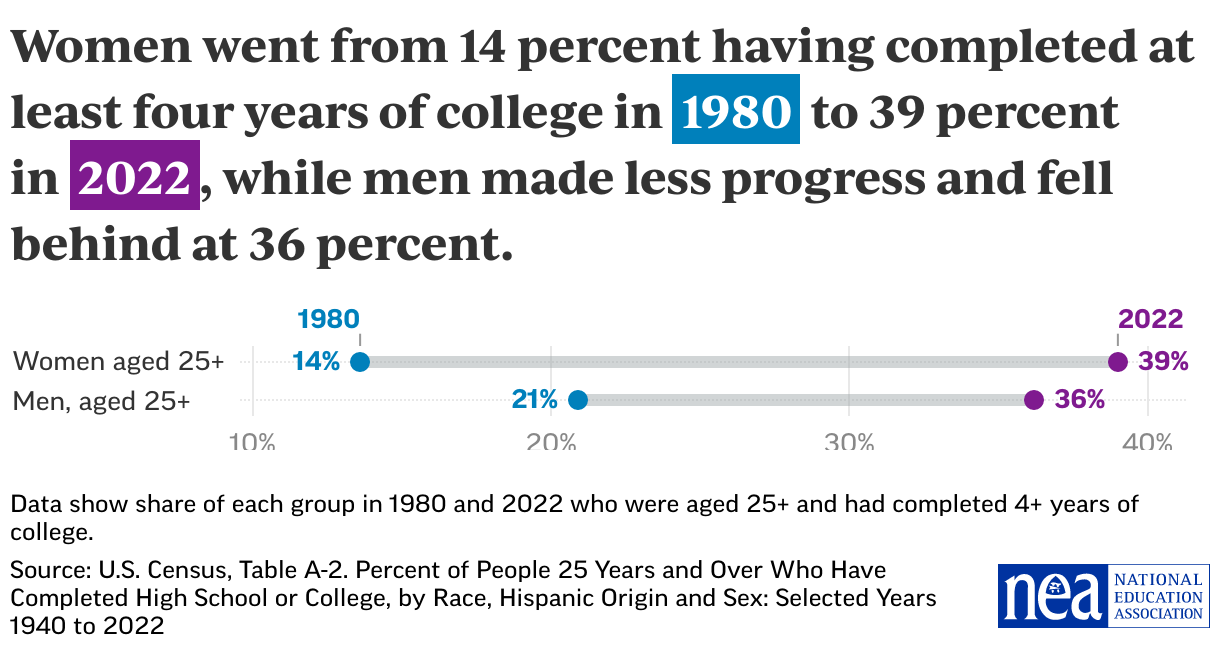
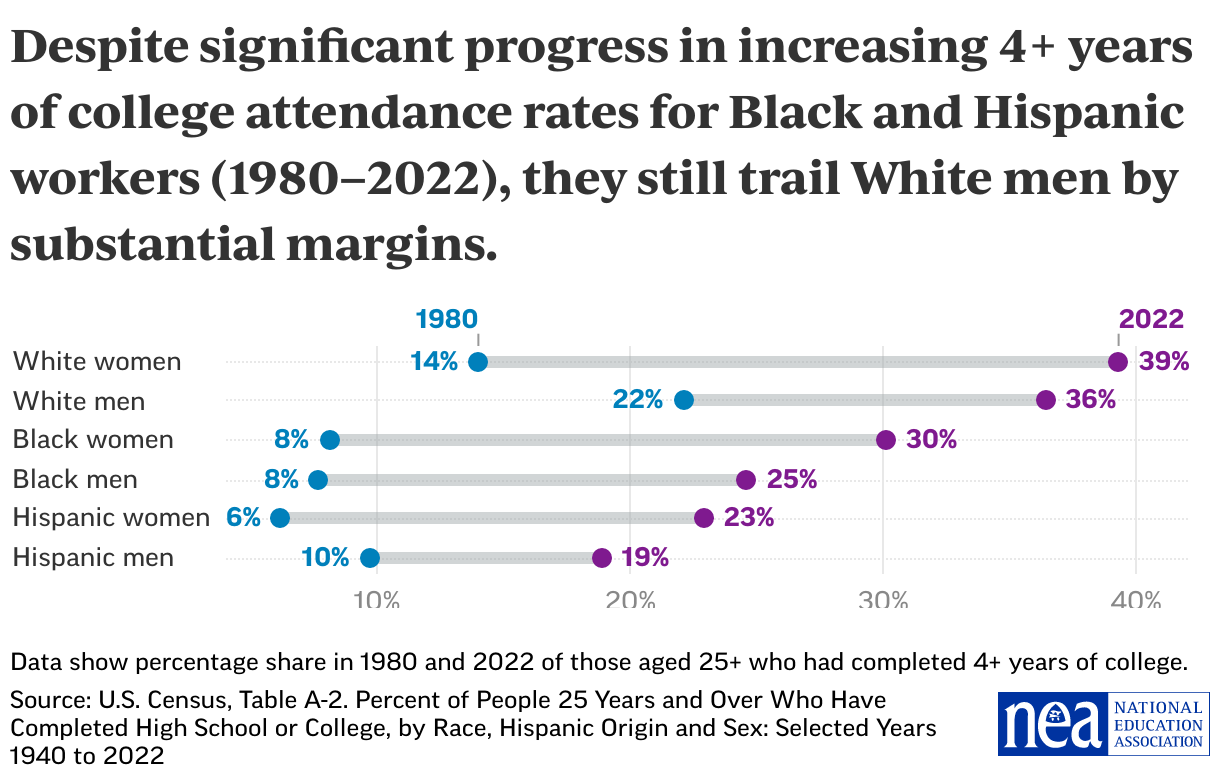
In terms of completing four or more years of college, the advantage has swung from men to women. As we see in the below chart, in 1980, considerably more men (21 percent) had completed at least four years of college than women (14 percent). In 2022, women led men by 3 percentage points, 39 percent to 36 percent.
Section with embed
The second point to be made here is that not only was the greatest progress made by women in general, but also that White, Black, and Hispanic women each outgained their male counterparts on this indicator over this period. White men still retained their relatively high ranking, with 36 percent having completed four or more years of college, but their 14-percentage-point gain between 1980 and 2022 exceeds only the 9-percentage-point gain of Hispanic men over the same period.
And yet, despite all that progress, we find ourselves in the situation (see chart, below) where in 2022 the share of White men who had completed at least four years of college (36 percent)—although 3 points lower than for White women (39 percent)—is still considerably higher than the comparable numbers for Black women (30 percent), Black men (25 percent), Hispanic women (23 percent), and Hispanic men (19 percent).
Section with embed
College Degree Recipients
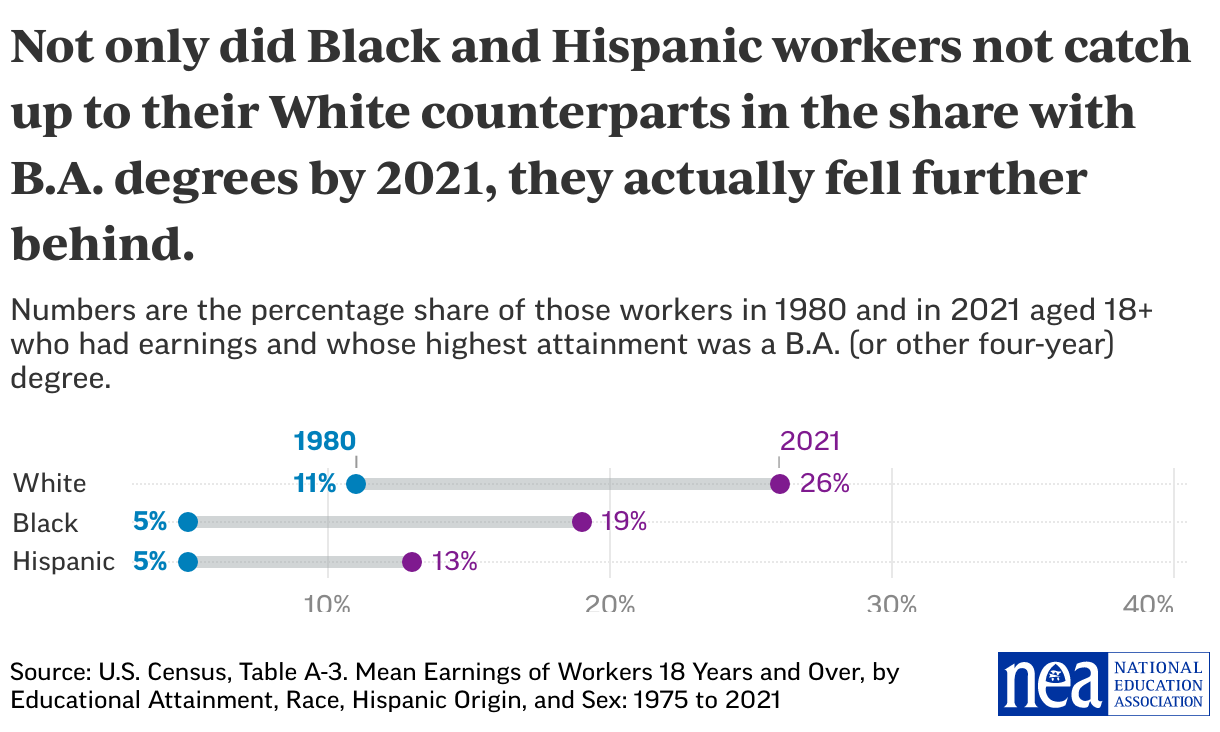
While the gains in completing four or more years of college for Black and Hispanic workers does at first seem encouraging, it is at the same time quite discouraging that after four decades, the gaps with their White counterparts couldn’t actually be closed. And it’s actually worse than that: In the below chart, we look beyond the four-year attendance rates to B.A. (or equivalent four-year) degree completion rates, and we find that Black and Hispanic workers have, in fact, lost ground. While the share of Black workers with B.A. degrees (5 percent) was 6 percentage points lower than was the share of White workers (11 percent) in 1980, by 2021, the gap had grown to 7 percentage points (19 percent for Black workers versus 26 percent for White workers). Even as substantially higher shares of Black workers are now earning four-year and advanced degrees than was the case in 1980, the Black-White gap at the B.A. level is now one point larger than it was, while the Hispanic-White gap more than doubled.
Section with embed
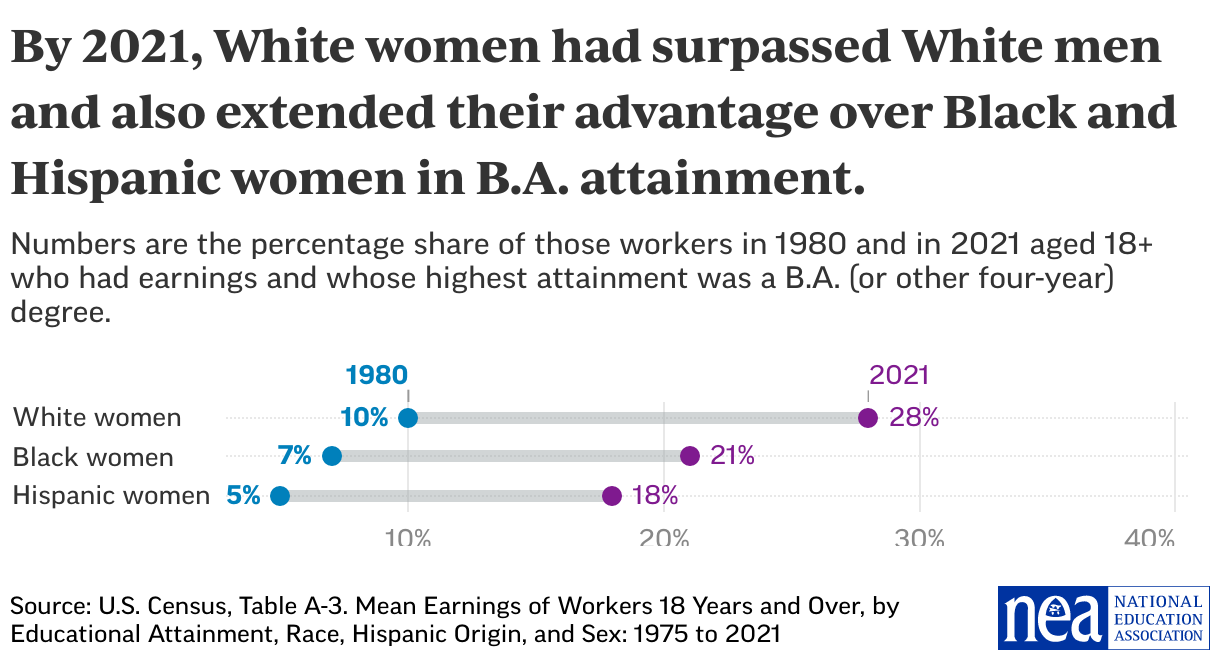
Looking deeper into this, we find that the leading driver of the changes in four-year degree completion status is the gains made by women in comparison to men. Women trailed men in 1980 by 1 percentage point, 10 percent to 11 percent. By 2021, women were leading men by 3 percentage points, 27 percent to 24 percent.
When we look deeper still, we find that it is the gains of White women that were mainly driving the overall gains for women. As seen in the next chart, despite notable progress made by Black and Hispanic women in earning B.A. or equivalent degrees, White women still made greater gains than their Black and Hispanic counterparts on this measure, by 4 and 5 percentage points, respectively.
And if you compare the next two charts, you can see that while White women trailed White men in 1980, that by 2021, more White women workers had B.A. degrees than White men, 28 percent to 24 percent.
Section with embed
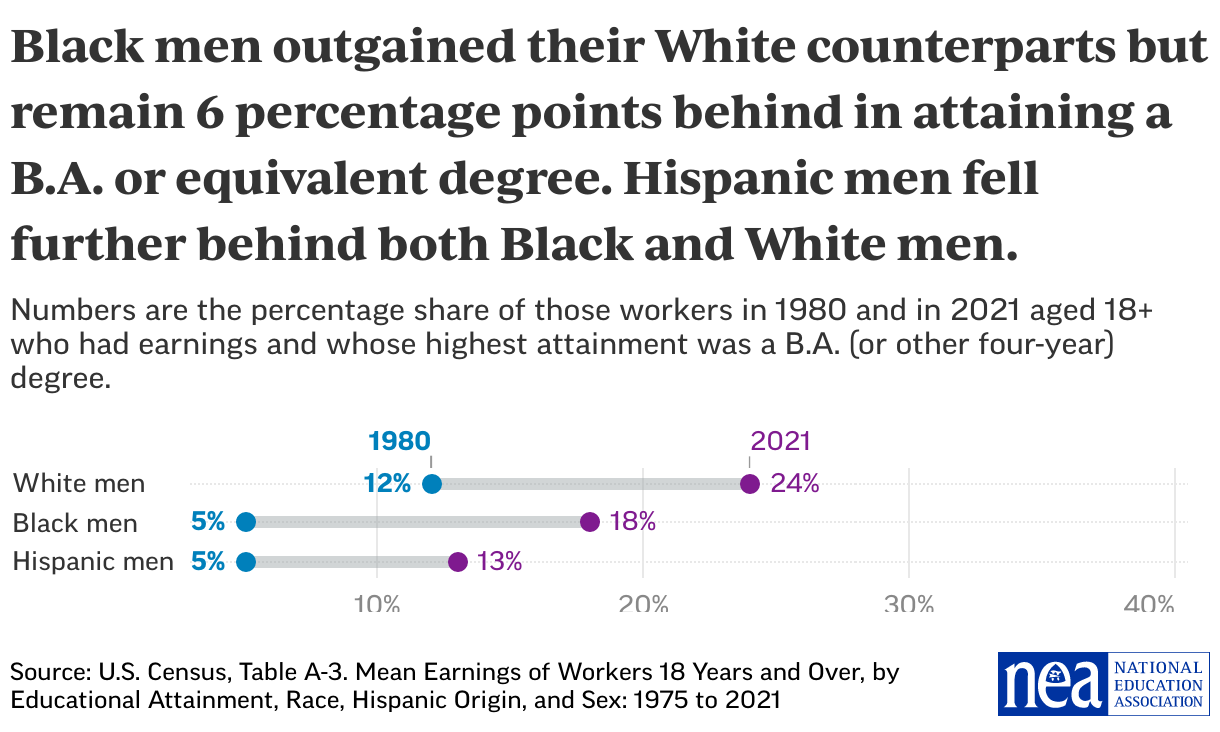
Meanwhile, Black men did manage to trim the Black-White gap in B.A. attainment by 1 percentage point over this period, but still trail White men by 6 percentage points (24 percent to 18 percent). Hispanic men, while nearly tripling their B.A. attainment rate, fell further behind both their Black and White counterparts.
Section with embed
Income
Given the very large gaps in educational attainment that favored White male workers in 1980 and the impressive strides made by White women, Black men, and Black women on some measures of educational attainment since then, we would hope to find a similar closing of the income or earnings gaps between these other groups and White men by 2020. And yet, the National Women’s Law Center found that, over the course of a 40-year career for an average woman, she loses an average of just over $400,000 in earnings due to the gender wage gap—and would have to work to age 69 to catch up to with what the average man would have earned by age 60. But that summary finding masks even more pernicious findings, which is how these gender gaps are further compounded by racial disparities. For example, Native women and Hispanic women both lose more than $1 million over a 40-year career compared to their male counterparts.
It’s not just those directly affected—women, Native People, and People of Color—who are harmed by the existence of these earnings gaps. As noted above, a 2021 San Francisco Federal Reserve Bank report estimated that total U.S. economic output would have been $2.6 trillion higher in 2019 if it were not for the negative labor market effects that produce earnings gaps based on race, ethnicity, and gender.
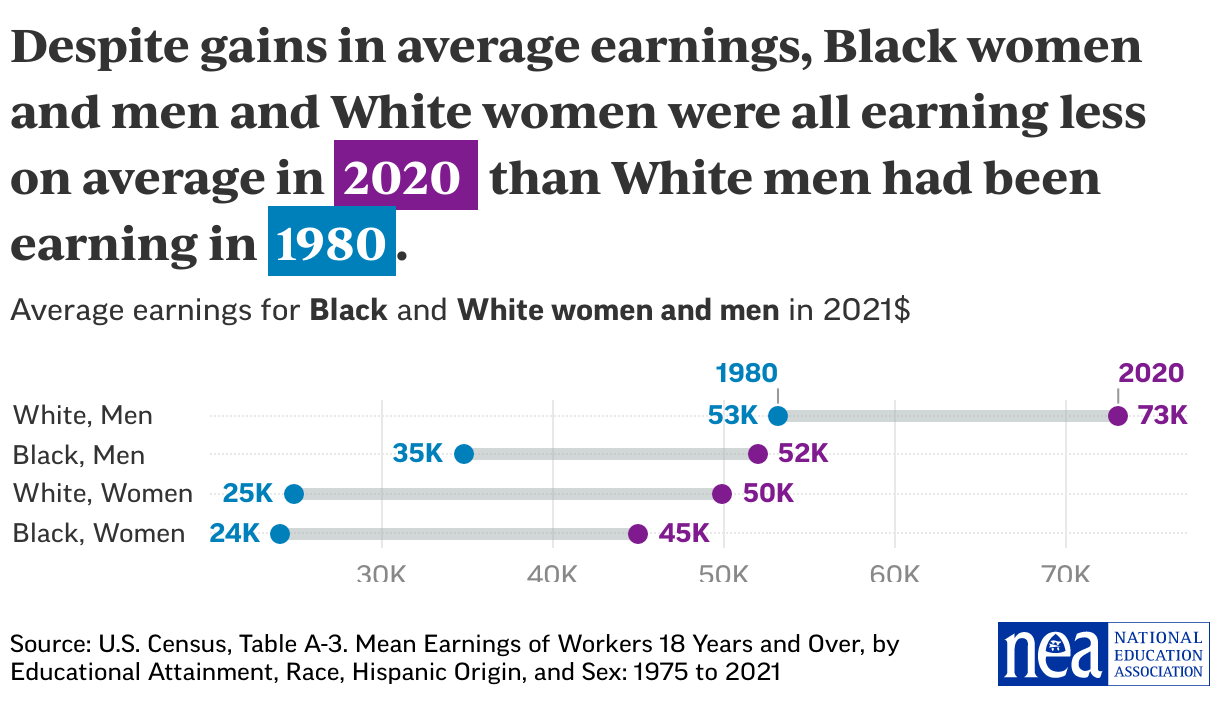
NEA Research analysis of Census data unearthed a stunning finding in regard to the continuing, unrelenting earnings gaps between racial and gender groups: White men were earning more on average back in 1980 than Black men, Black women, and White women earned in 2020, even after adjusting for inflation. We can see this in the below chart, which shows these data for Black and White men and women: As you can see, the average 2020 earnings of Black men ($52,000) and Black ($45,000) and White ($50,000) women all fell short of the mean 1980 earnings of White men, who were earning $53,000 on average at that time and who have seen their earnings increase to $73,000 in the meantime.
Section with embed
Income and Educational Attainment
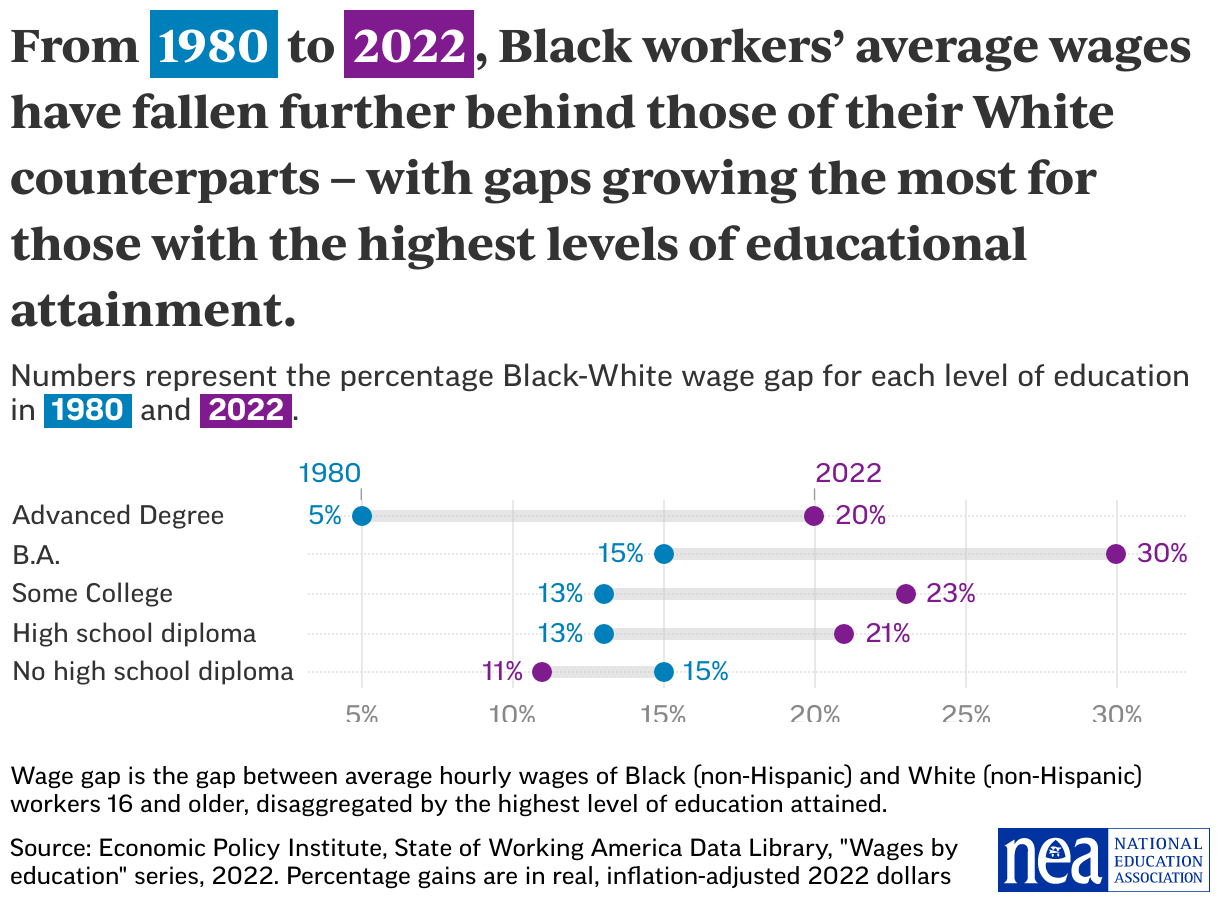
With the substantial progress made in educational attainment by Black workers since 1980, we would hope to find that earnings gaps had been reduced somewhat, if not proportionately to education gaps. And yet, we find that the opposite is true: earnings gaps have, by and large, grown larger over time.
Moreover, the higher the level of educational attainment, the higher the growth in the Black-White earnings gap. In the below chart, we can see that the Black-White earnings gap has increased by 15 percentage points among those with advanced degrees (from 5 percent to 20 percent) and by the same 15 percentage points for those with four-year degrees (from 15 percent to 30 percent). The percentage point increases were smaller at the ‘some college’ and high school diploma levels (10 and 8 percentage points, respectively), and among workers without a high school degree, change was in the opposite direction, with the gap shrinking from 15 percent to 11 percent.
Section with embed
An Economic Policy Institute study published in 2022 found that after statistically adjusting for differences in education, job experience, and geographic region, the hourly wage gap between the typical Black and typical White worker widened over the 40 years from 1979 and 2019, from 16 percent to 24 percent. They also found that the unexplained portion of the wage gap—indicative of probable discrimination—had also grown. In an earlier 2016 study, the same authors obtained similar results when they compared Black and White men and Black and White women. Here, too, they found that the Black-White earnings gaps for both men and women had not only persisted but had gotten substantially worse since 1980. In conclusion, the study’s authors found “compelling empirical evidence and a solid historical record that points to discrimination as a significant factor in the persistence of racial disparities in the labor market.”
And so, despite progress in Black Americans achieving higher levels of education, Black average wages—even after controlling for the rational and measurable differences listed above—have fallen further behind White average wages, and the unexplained portion of the wage gap that remains has grown over time. By all appearances, the impact of discrimination and institutional racism on job market outcomes is real and is not going away.
Unemployment
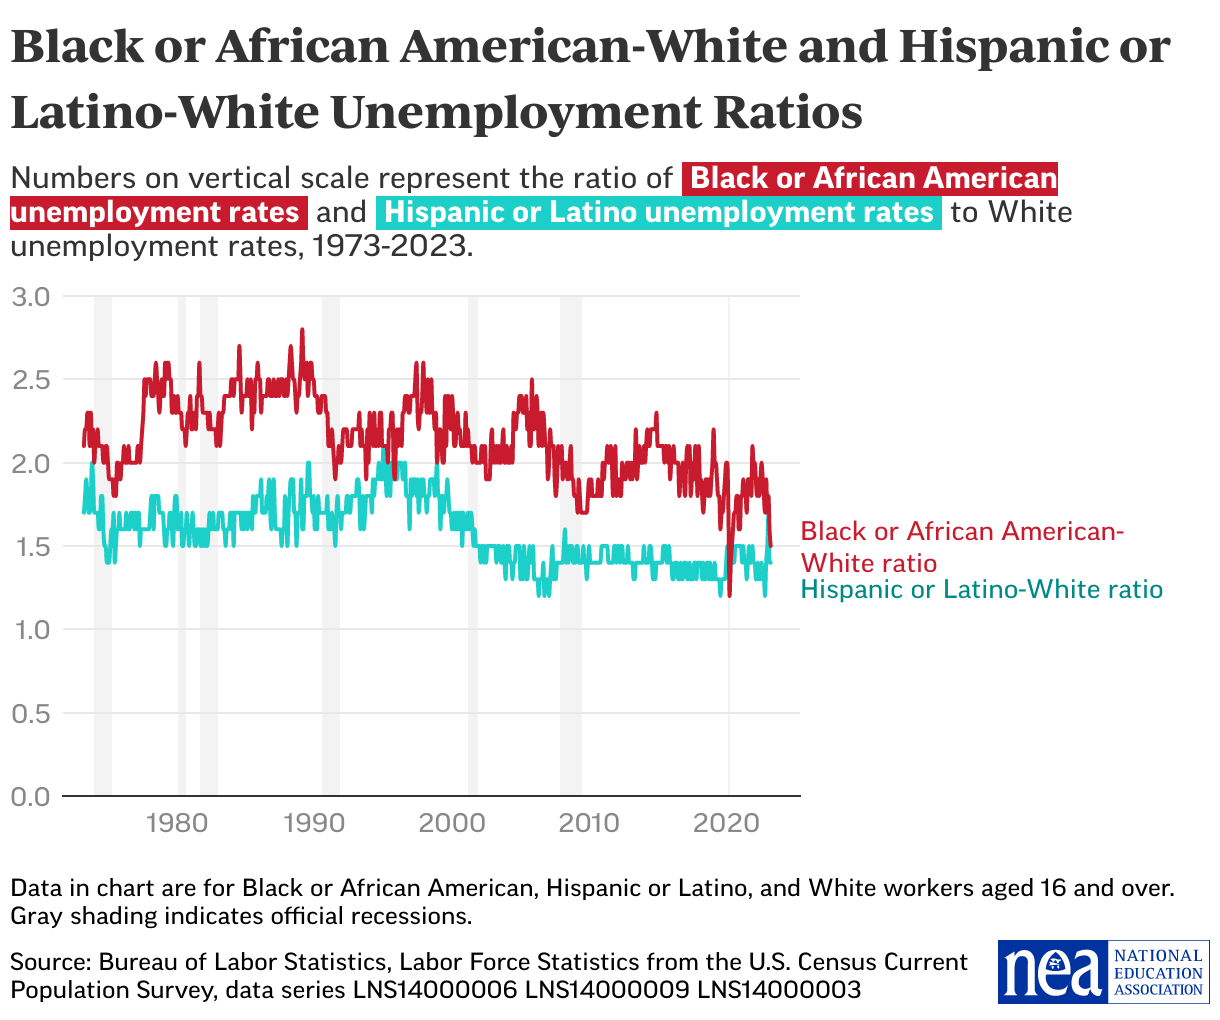
Unemployment rates vary month to month, quarter to quarter, and year to year, often wildly. The below chart presents historical data on unemployment rates for Black or African American, Hispanic or Latino, and White workers aged 16 and older, from 1973 through April 2023. What is clear is that regardless of whether unemployment is high or low in the economy, the rank order generally remains the same: higher rates for Black or African American workers, lower rates for White workers, with Hispanic or Latino workers in the middle (there are just a couple months, mostly in the peak pandemic period, when Hispanic or Latino unemployment equaled or surpassed Black or African American unemployment).
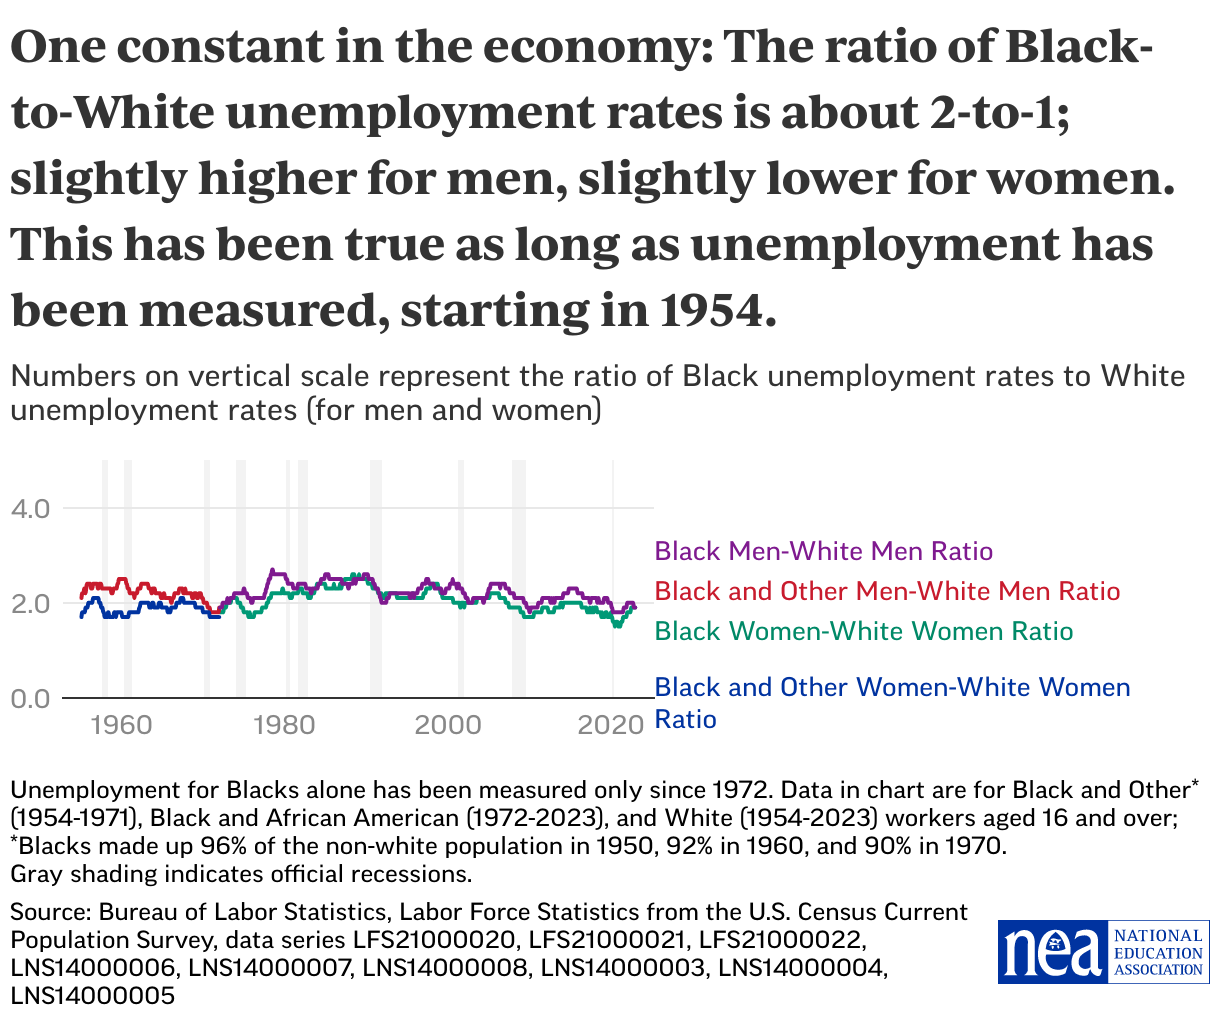
In fact, one of the most consistent, enduring features of the U.S. labor market is the 2-to-1 ratio in unemployment that exists and has existed between Black and White workers, dating back to the early 1950s when unemployment data were first collected. In other words, Black workers are consistently twice as likely to be unemployed than White workers. In the below chart, we can see that over these last 70 years, the Black-White unemployment rate ratio has remained about 2-to-1, impervious to the ups and downs of unemployment rates and state of the economy, and it holds true for both men and women. (Note that prior to 1972, data were collected only for “White” and “Black and Other” workers. More than 90 percent of the “Black and Other” workers were Black. Since 1972, unemployment data have been reported for “Black or African American,” and since 1973, for “Hispanic or Latino” workers.)
Section with embed
Historically, the Hispanic or Latino-White unemployment rate ratio has been similar to the Black or African American-White ratio in that it sits consistently within a fairly narrow band. But in the case of Hispanic or Latino unemployment, the narrow band in which the ratio sits is lower, lying between 1.2-to-1 and 2.1-to 1.
A note on post-pandemic shifts: It should be noted that historically low unemployment rates have been recorded for Black or African American workers (4.7 percent, April 2023), Hispanic or Latino workers (3.9 percent, September 2022), and White workers (3.0 percent, December 2022) in the post-pandemic period. It should also be noted that when unemployment for Black or African American workers hit that all-time low rate of 4.7 percent, the Black or African American-White unemployment ratio still dropped only to 1.52-to-1, which is still within the 2-to-1 ratio band when rounded up.
Section with embed
Unemployment and Educational Attainment
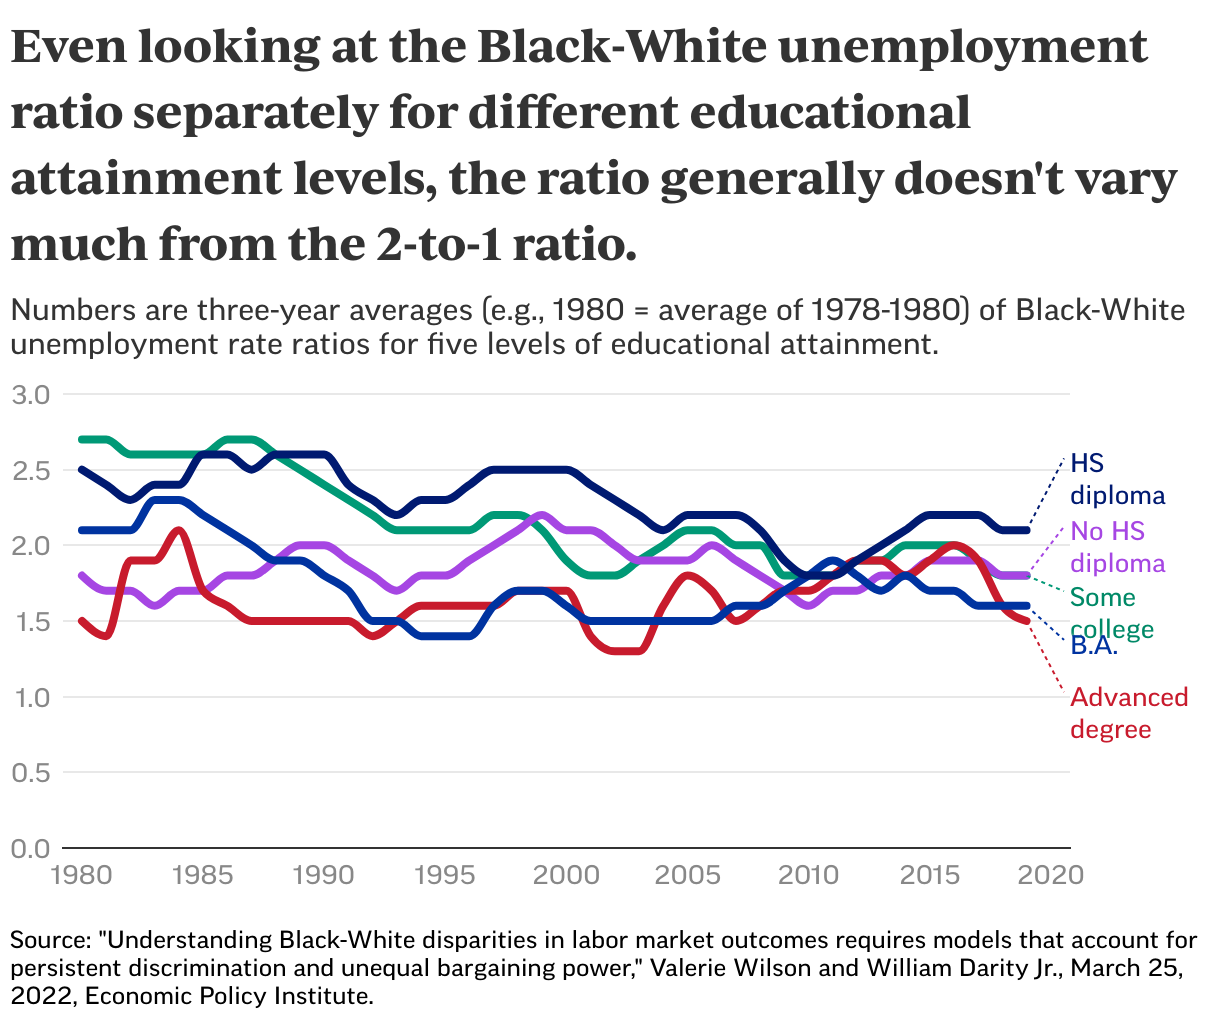
In the next chart, we can see that between 1980 and 2019 (using three-year running averages to smooth out year-to-year fluctuations), there is some positive movement, as three of the attainment levels—high school diploma, some college, and B.A. —saw their Black-White unemployment rate ratios narrow somewhat over time. Yet, the other two attainment levels—less than high school diploma and advanced degree—recorded the exact same ratios in 2019 as in 1980.
Despite some observable reduction in the unemployment rate ratio over the decades for those with certain levels of education, that doesn’t alter the main story: The fact remains that nearly every data point we have here, for five education levels across four decades, sits between 1.5-to-1 and 2.5-to-1. When rounding those numbers, we get the 2-to-1 ratio. In any given month, regardless of educational attainment level and regardless of the state of the economy, Black workers are still today, as they have been for as long as unemployment statistics have been collected, twice as likely to not find a job as Whites.
Indeed, the significant racial disparities in unemployment that are observed at each level of education, across age cohorts, and among both men and women are the strongest evidence against the notion that education or skills differentials are responsible for the Black-White unemployment gap.
Section with embed