
Introduction
Economic inequality and racial and gender wealth divides have remained persistently high over the last three decades. Centuries of systemic oppression, discrimination, exploitation, and expropriation have blocked Native People, People of Color, women, and LGBTQ+ individuals and families from accumulating wealth, which has constrained intergenerational wealth transfers and economic mobility.
The Federal Reserve Board’s Survey of Consumer Finances (SCF) provides the most consistent time-series survey data on issues of financial wealth, including net worth and its two components of assets and debts. Most of the data presented in the following sections originate from this survey. However, due to small sample sizes, its coverage of families in other racial or ethnic categories outside of Black, Hispanic, and White families is very limited. In addition, surveys such as SCF collect financial data at the family or household level, making it challenging to identify the extent of the gender wealth gap. Analyses are often limited to single women or female-headed households.
The National Community Reinvestment Coalition’s (NCRC) racial wealth snapshot for Native Americans and an Urban Institute analysis of Asian American, Native Hawaiian, and Pacific Islander communities point out the lack of wealth and financial data for these groups. Data unavailability also constrains wealth gap analysis for LGBTQ+ individuals.
The Federal Reserve Board’s Survey of Household Economics and Decisionmaking (SHED) and the Census Bureau’s Survey of Income and Program Participation (SIPP) and Household Pulse Survey (HPS) can fill in some data gaps; however, more disaggregated wealth and financial data are needed to understand the full scope of inequality.
Net Worth
What is Net Worth?
The value of a family's, or household's, wealth after deducting debt from assets.
- Financial—bank accounts, retirement accounts, and stock investments
- Non-financial—houses, real estate, businesses, and vehicles
Mortgages, home equity loans, credit card balances, student loans, and other types of loans.
Family, or household, net worth represents the amount of a family’s wealth after deducting the amount of debt from the amount of assets. Assets are considered either financial—bank accounts, retirement accounts, stock investments, etc.—or non-financial—houses, real estate, businesses, vehicles, etc. Debt includes mortgages, home equity loans, credit card balances, student loans, and other types of loans. Due to extreme wealth inequality within all categories, medians are a better measure of a typical family's financial picture than averages. Throughout this analysis, we use the racial and ethnic categories employed in the original data source.
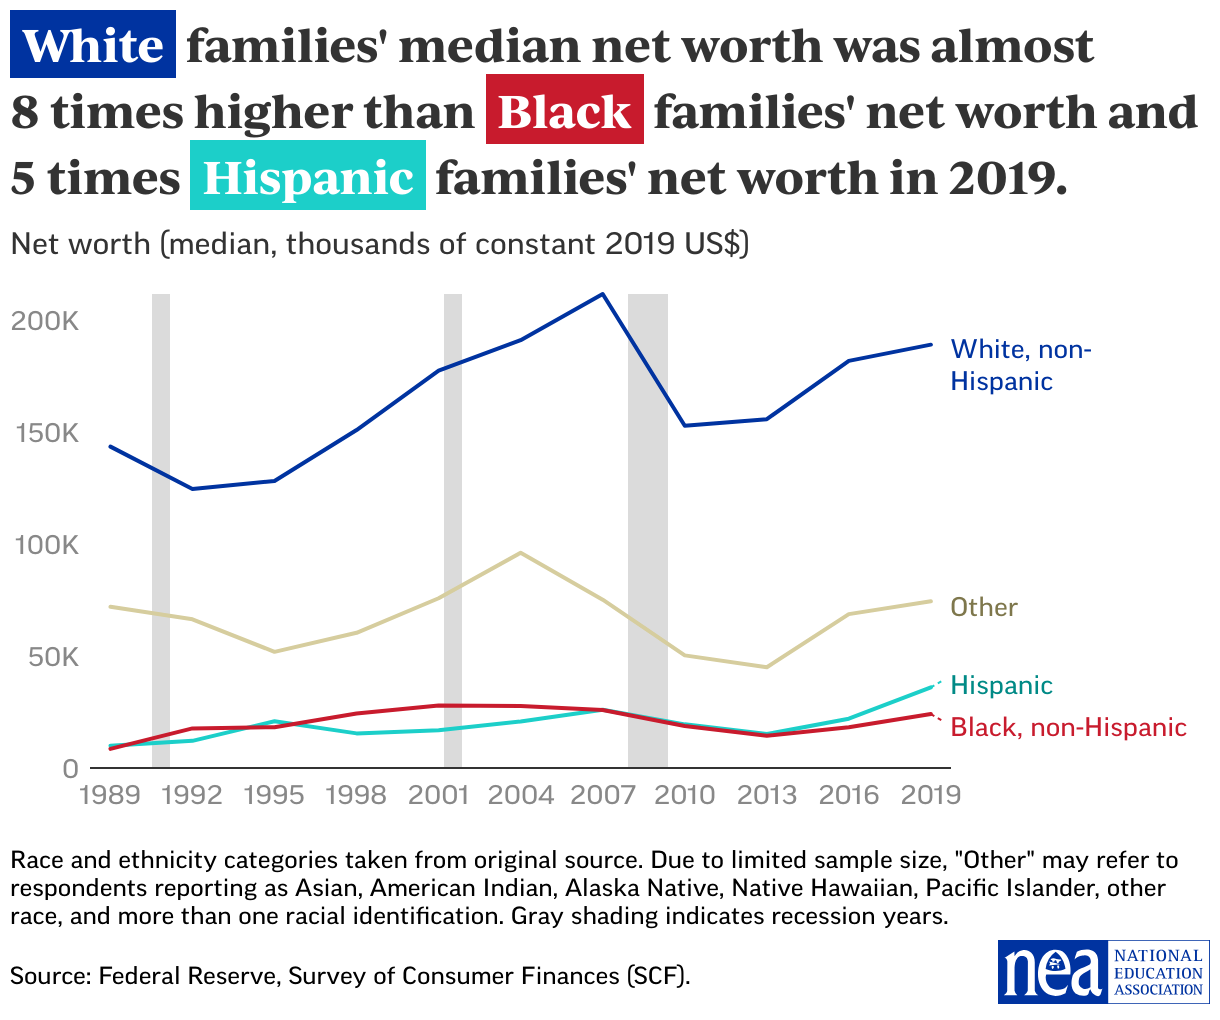
According to the most recent SCF data, the median net worth of families in the United States was $121,800 in 2019. After adjusting for inflation, this value is higher than in 1989 but not as high as its level before the Great Recession of 2007–2009. The Great Recession and subsequent political and economic trends—including job losses and foreclosures, wage stagnation and suppression, wage theft, rising health care and college costs, jobs-housing imbalances that drove up housing costs in major metropolitan areas over the past decade, and political suppression—adversely affected asset and debt accumulation for all but those in the highest income bracket. These trends harmed Black and Hispanic households more severely than White households, compounded by ongoing employment inequities, income gaps, housing barriers, and other forms of systemic discrimination.
The median net worth varies greatly among families from different racial and ethnic groups. The median net worth of Black families in 2019, at $24,100, represents about an eighth of the amount for White families, at $189,100. For Hispanic families, the median net worth of $36,100 was about a fifth of that of White families.
Section with embed
An analysis of SCF data revealed that wealth inequality within the Asian families grouping might be greater than among White families. According to recent SIPP data, the median net worth of Asian and non-Hispanic White households were statistically similar. Yet, wealth disparities between different ethnicities within the Asian and Pacific Islander community can be quite significant.
Due to the lack of government data, the median net worth of Native families or households is unknown. An analysis by the Washington Center for Equitable Growth references a study of the net worth of the Cherokee and Muscogee Creek tribes in Oklahoma. The net worth of White families in the area was 15 percent higher than enrolled Cherokee families and four times as high as enrolled Muscogee Creek families. A Minneapolis Federal Reserve study found that the median net worth of a sample of households who lived on the Cheyenne River Sioux Reservation in South Dakota was 3 percent of the median net worth of White households.
The most recent SHED data reveal differences between LGBTQ+ and non-LGBTQ+ households. In 2022, 75 percent of non-LGBTQ+ adults thought they were “doing okay financially,” while only 65 percent of LGBTQ+ adults, and 55 percent of transgender or non-binary adults, responded affirmatively. The Census Bureau’s Household Pulse Survey also found that LGBT households experienced greater financial, employment, housing, and food insecurity during the COVID-19 pandemic.
As with the wage gap, the wealth gap for women of color is greater than for women in general. One analysis of SCF data found that in 2019, married or partnered White men had the highest amount of family wealth (excluding vehicles) at $298,000 compared with single non-Hispanic White women at $81,200, single non-Hispanic Black women at $1,700, and single Hispanic women of any race at $1,000. A Federal Reserve Bank of St. Louis study of female respondents determined that age, marital status, race/ethnicity, and education are all significant factors in the wealth gap. Yet, even when these and other factors were taken into account, female respondents’ median wealth was less than male respondents’ wealth.
Assets
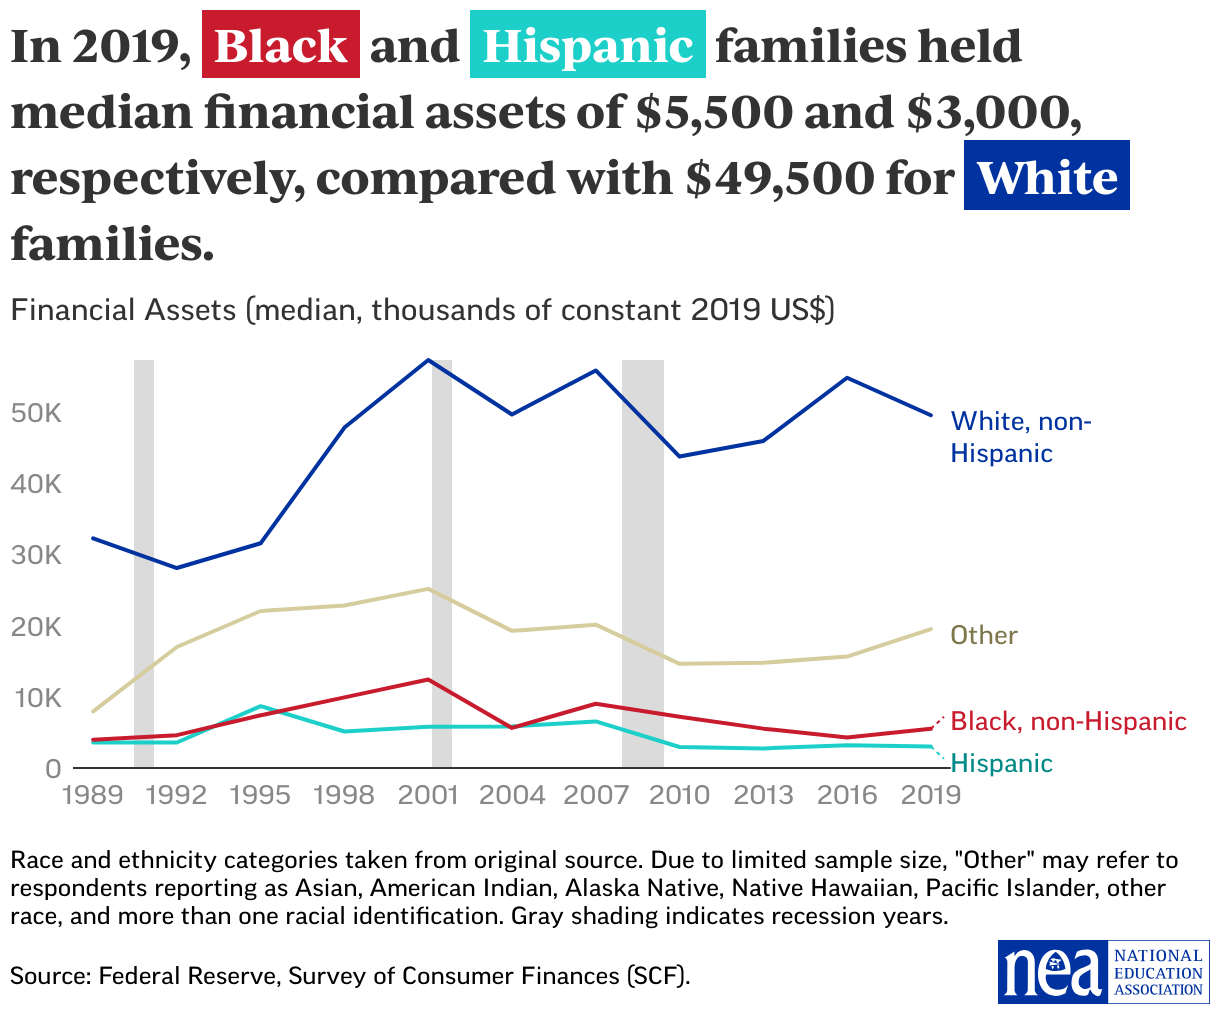
This section will review the most common financial assets, including banking accounts, retirement accounts, and stock investments as well as the most common non-financial assets, including primary residences and vehicles. In 1989, the median amount of financial assets for Black families was $4,000, increasing to $5,500 in 2019. For Hispanic families, the median decreased from $3,600 in 1989 to $3,000 in 2019. In contrast, White families’ median amount of financial assets grew from $32,200 in 1989 to $49,500 in 2019. Median non-financial assets totaled $225,000 for White families in 2019, compared with $82,000 for Hispanic families and $70,000 for Black families.
Section with embed
Banking
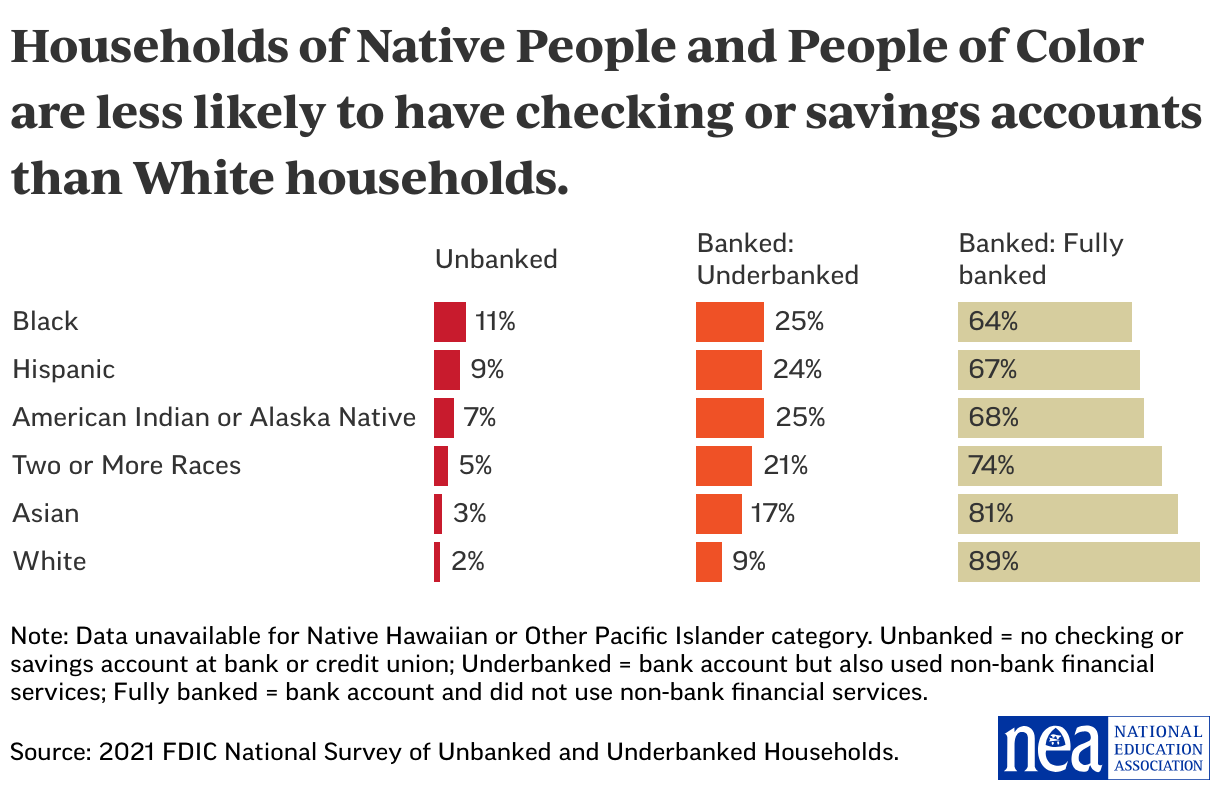
According to a recent Federal Deposit Insurance Corporation (FDIC) survey, 11 percent of Black households were “unbanked,” meaning they did not have a checking or savings account at a bank or credit union, compared with 2 percent of White households. Twenty-five percent of Black households were “underbanked”—having a bank account but also using non-bank financial services, such as money orders, money transfers, and check cashing—compared with 9 percent of White households. Hispanic and American Indian/Alaska Native households were also significantly more likely than White households to be unbanked or underbanked.
Section with embed
Historically, Black, Latin(o/a/x), and Native communities have had limited access to banking services due to discriminatory practices such as high fees and minimums, alongside a lack of bank branches in communities of color and lower-income communities, relating to redlining and community disinvestment. In addition, these communities lack trust in financial institutions and the use of financial products because of expensive, inequitable fees; biased practices of wage garnishment; unjust barriers to bankruptcy protections; and bank fraud and failures. While the primary reason for not holding a bank account was lack of money, the second and third most common main reasons were lack of trust and privacy according to the FDIC survey.
Retirement Accounts
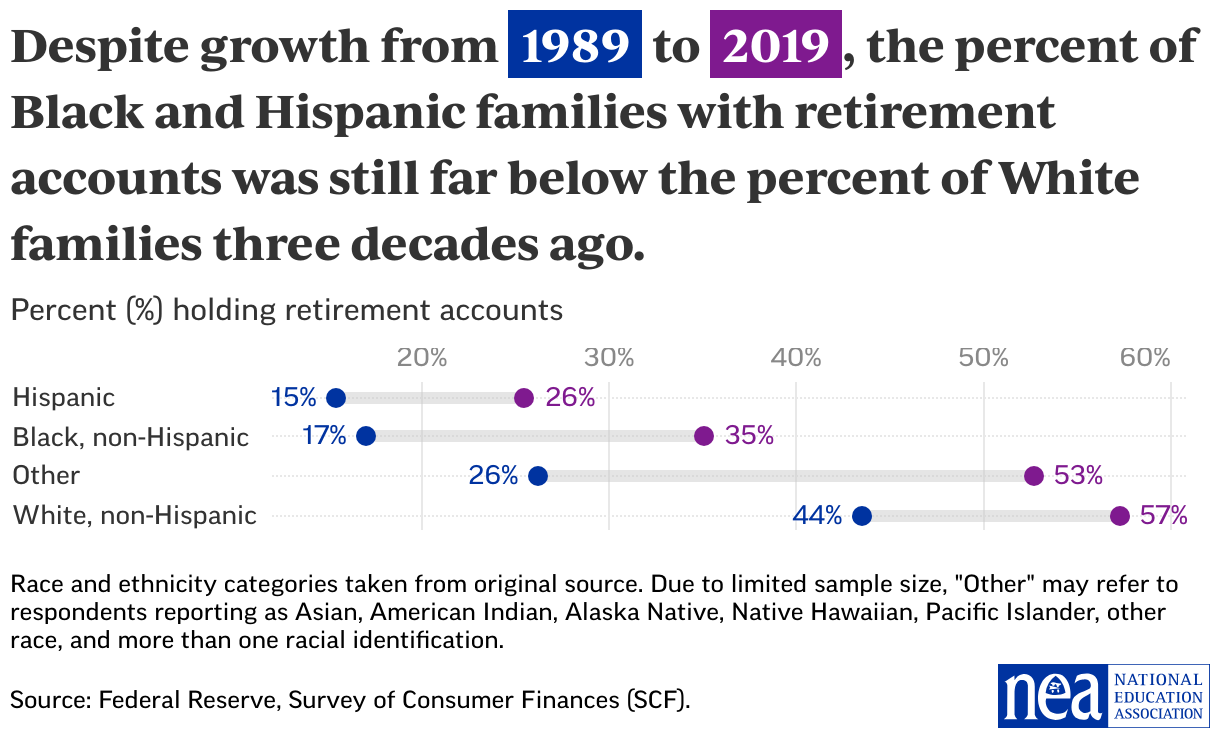
The share of Black and Hispanic families with retirement accounts grew significantly from 1989 to 2001 but has declined since then, with levels in 2019 still far below the percentage of White families with retirement accounts in 1989. The median value of retirement accounts for Black and Hispanic families was less than half of the value of White families.
Section with embed
An Economic Policy Institute study found that women, women of color in particular, and LGBTQ+ individuals are also likely to have less to live on in retirement relating to factors of income, caregiving, marital status, and generally lower wealth accumulation.
Stock Investments
Similar to retirement accounts, the share of families owning stocks grew among Black and Hispanic families since 1989, with 34 percent of Black families and 24 percent of Hispanic families reporting stock investments in 2019. These shares were not as high as those for White families 30 years ago.
Section with embed
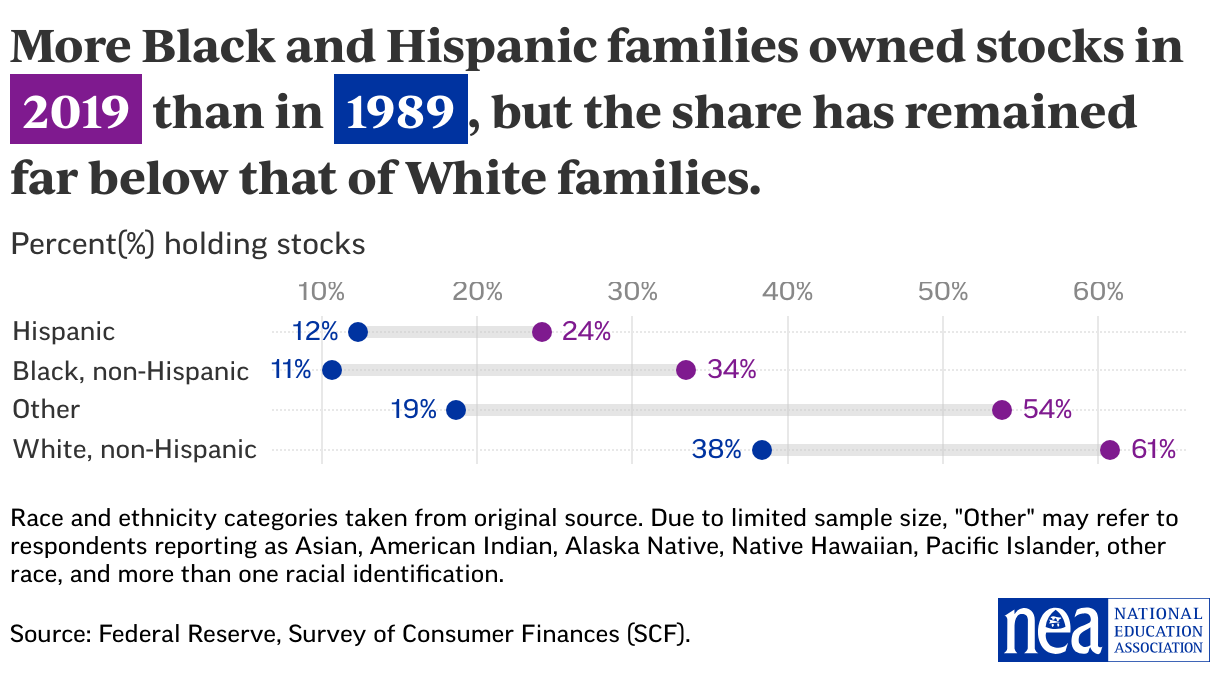
The FINRA Foundation’s National Financial Capability Study found that taxable investment account ownership was lowest among African American and Hispanic/Latina women.
Primary Residence
Primary residences (property that families live on and own, with or without a mortgage) can be one of the highest-value assets held by families. In 2019, 74 percent of White families held primary residence property, compared with 48 percent of Hispanic families and 45 percent of Black families. The median values of the primary residences were $230,000 for White families, $200,000 for Hispanic families, and $150,000 for Black families.
Section with embed
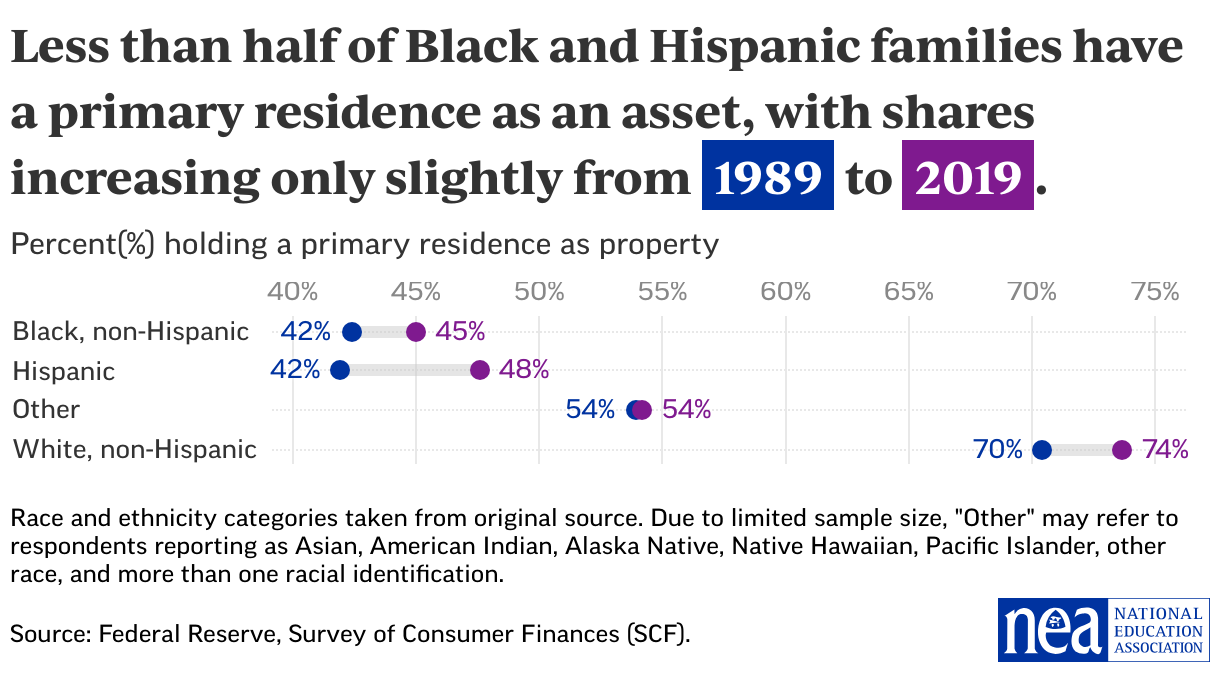
The resources on housing and homeownership provide more information about the factors affecting property ownership.
Vehicle Ownership
Of all non-financial assets, families are most likely to own vehicles. The percentage of Black families owning vehicles grew considerably from 1989 (57 percent) to 2019 (71 percent), while the share for Hispanic families increased from 77 percent to 84 percent during the same period. The share for White families remained unchanged at 89 percent.
Section with embed
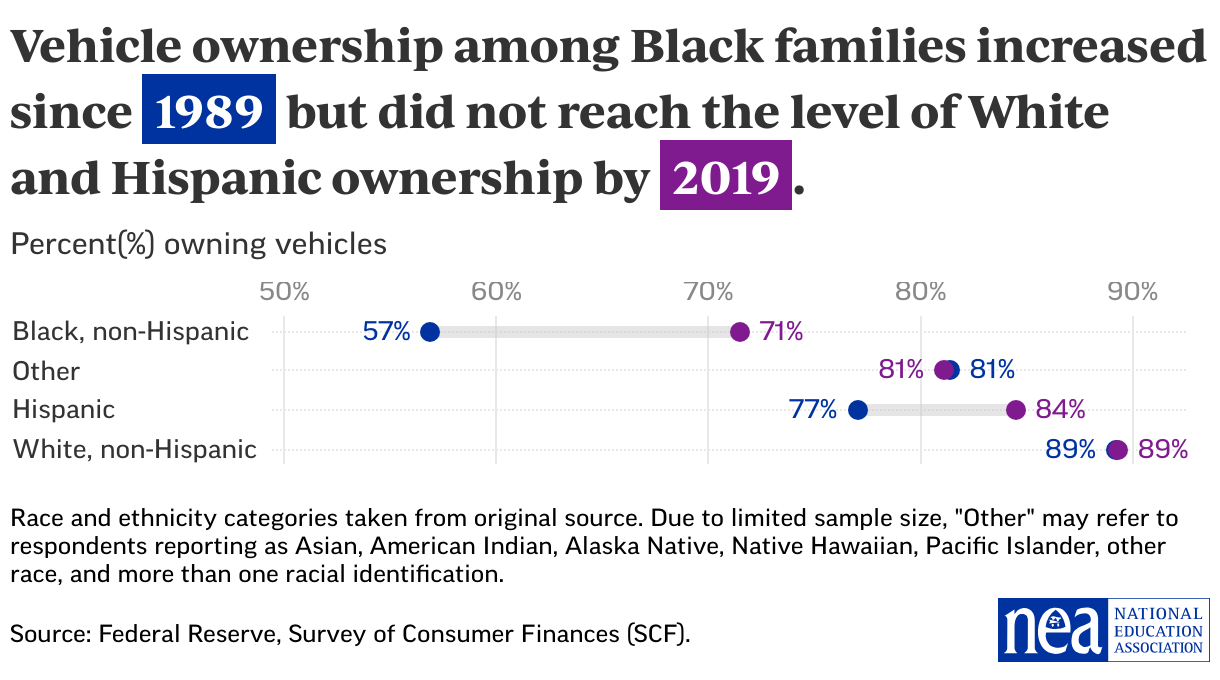
More disaggregated census data from 2020 published by the National Equity Atlas shows that 87 percent of Native People and People of Color households have a vehicle, compared with 95 percent for White households. In male-headed households, 93 percent have a vehicle, compared with 90 percent of households headed by women. The shares for Latina-headed households (87 percent), Native American female-headed households (87 percent), and Black female-headed households (80 percent), are even lower.
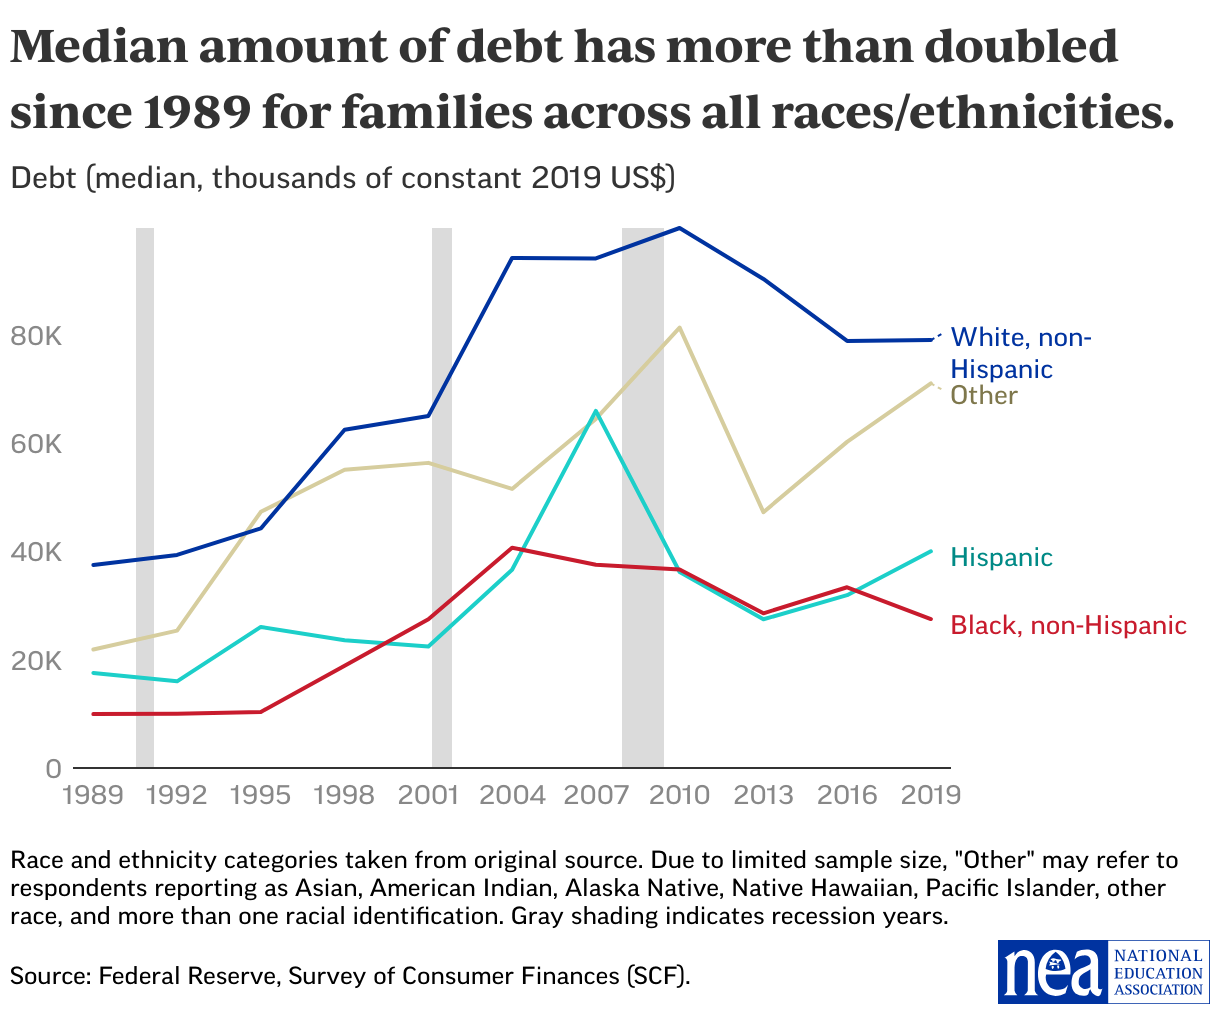
Debt
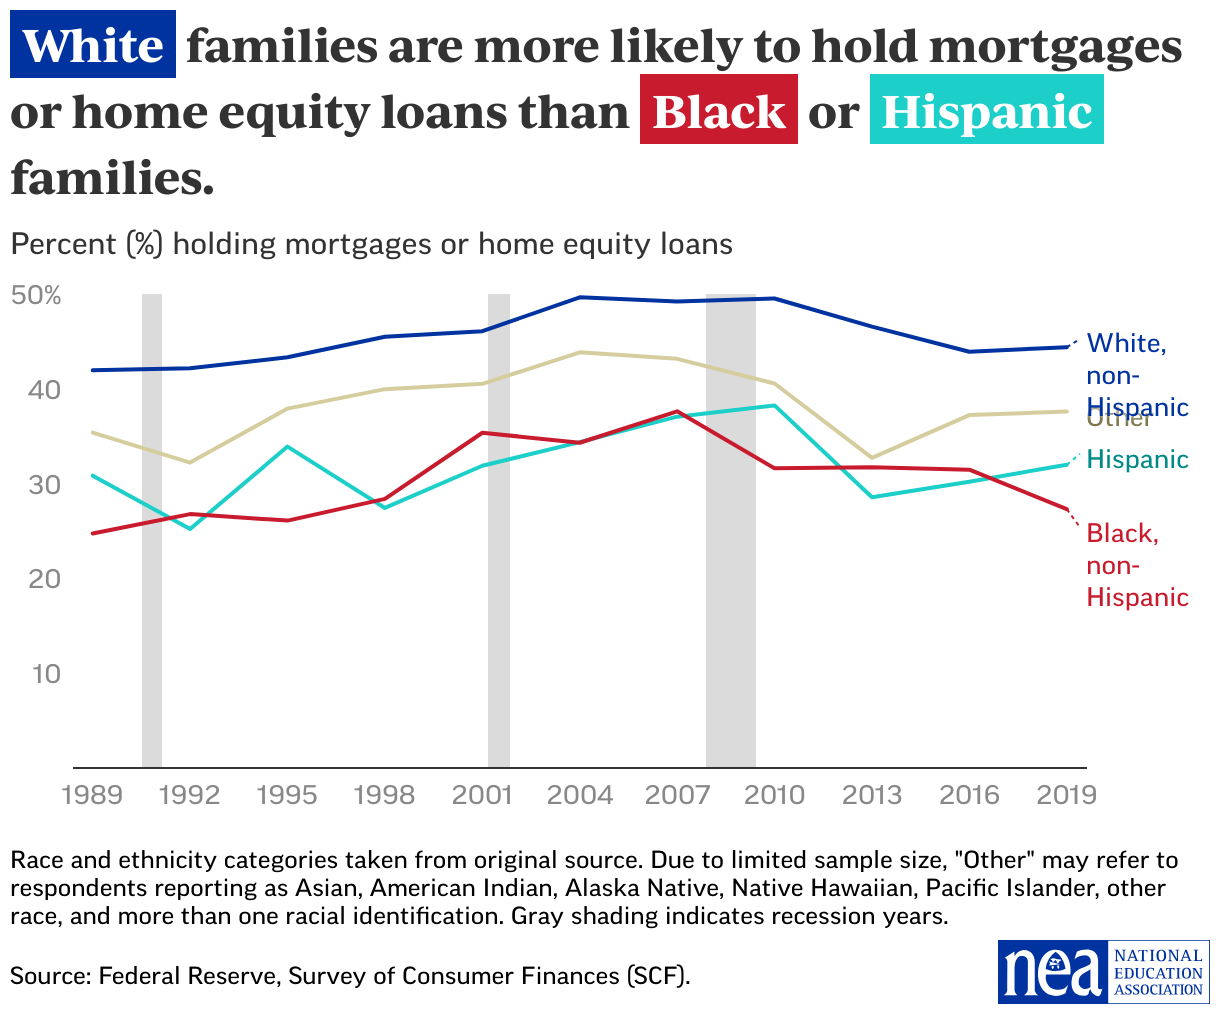
The median amount of debt increased significantly across all racial and ethnic groups from 1989 to 2019. Racial discrimination plays a major role in debt accumulation and exacerbates wealth inequality. White families were more likely to hold a mortgage or home equity loan, while Black and Hispanic families were more likely to have credit card balances. Mortgages and home equity loans reflect trends in homeownership. Mortgage debt is often regarded as “good” debt, representing a long-term investment that allows families to build wealth. Communities of color are more likely to have debt in collections.
Section with embed
Mortgage or Home Equity Loans
The median amount of mortgages or home equity loans for all families more than doubled from $62,000 in 1989 to a record $140,000 in 2019 (in inflation-adjusted dollars), reflecting the disparities between home prices and wealth in the United States. Families for whom homeownership was not entirely out of reach are taking on more debt to purchase homes. The share of all families with mortgages or home equity loans peaked at 47 percent in 2007 and declined after that. Less than one-third of Hispanic and Black families held mortgages or home equity loans, compared to 44 percent of White families in 2019. Although shares remained similar to 1989, the median amount of these loans quadrupled for Black families and doubled for White families by 2019. For Hispanic families, the median amount was 1.5 times that of 1989.
Barriers to mortgage approval due to lack of income and discrimination may result in People of Color being more likely to use alternative financial arrangements. An NCRC analysis details the systemic barriers and disparities that Native Americans experience with the mortgage financing industry. The study found that Native Americans accounted for 0.9 percent of owner-occupied mortgages from 2018 to 2021.
Section with embed
Credit Card Balances
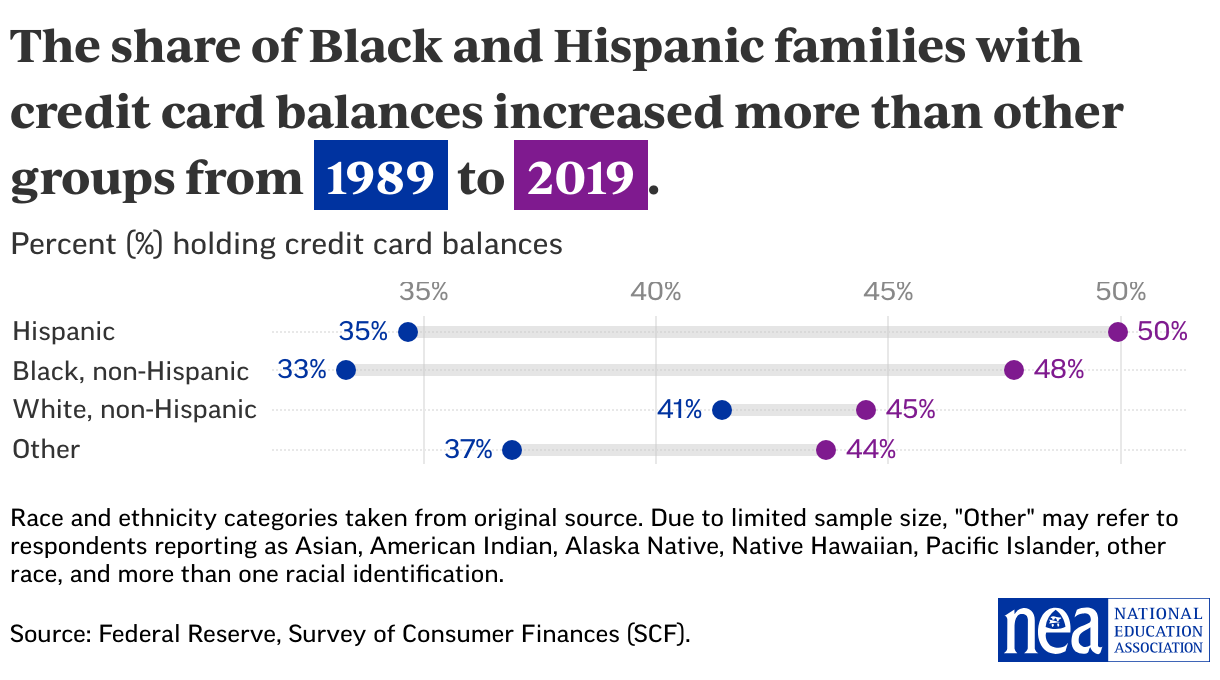
The share of all families with credit card balances increased from 40 percent in 1989 to 45 percent in 2019, with the median inflation-adjusted value also rising from $1,800 in 1989 to $2,700 in 2019. The percentage of Black and Hispanic families with credit card balances grew significantly more during this period, surpassing White families’ share. In 1989, 33 percent of Black families and 35 percent of Hispanic families held credit card balances, compared with 48 and 50 percent, respectively, in 2019.
Section with embed
Subprime credit scores raise the cost of borrowing and limit the ability to borrow. In 2021, the share of residents within Native American (44 percent), Black (42 percent), and Hispanic (29 percent) communities with subprime credit scores greatly exceeded the share in majority White (17 percent) communities. Gender also plays a role: Single women are more likely to have lower credit scores than single men.
Student Loans
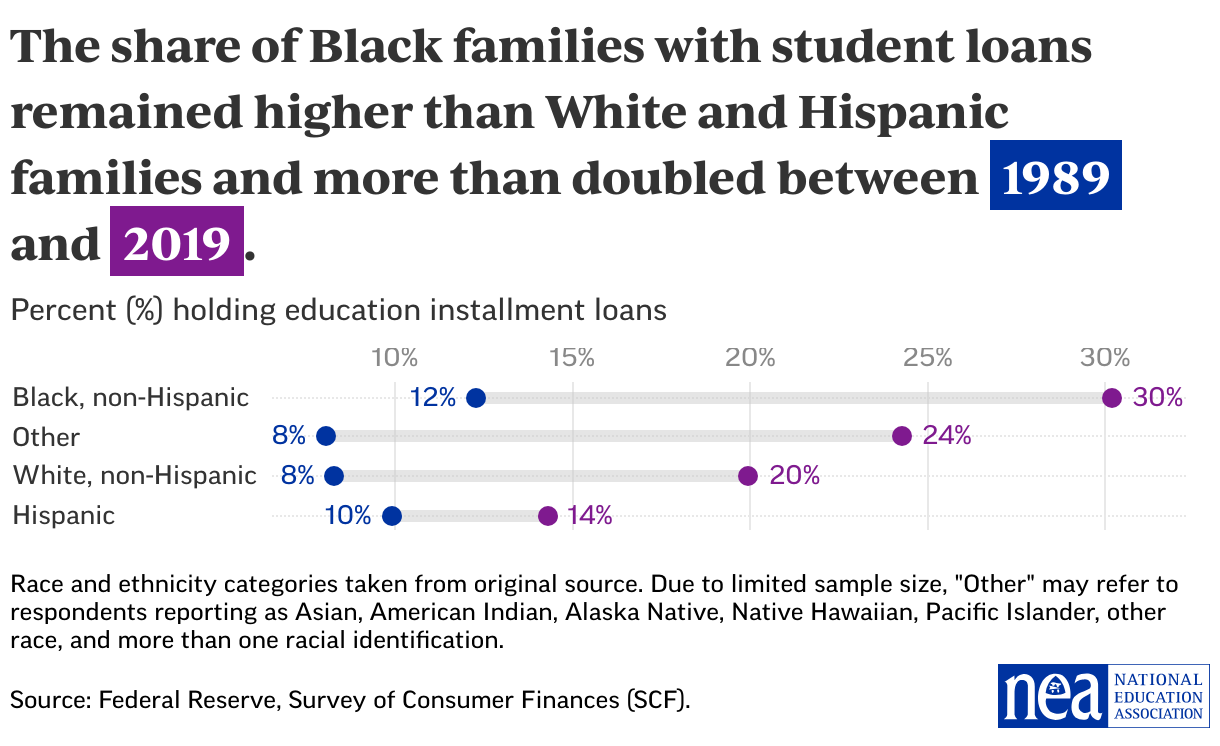
Driven by the steeply rising costs of college and postgraduate education, the median value of education installment loans more than tripled in inflation-adjusted dollars from $6,000 in 1989 to $22,000 in 2019. The percentage of families holding student loans more than doubled from 9 percent to 21 percent in those years. Almost one-third of Black families held student loans in 2019 compared with 12 percent in 1989. The share of Hispanic families holding student loans rose from 10 percent to 14 percent, while White households’ share climbed from 8 percent to 20 percent.
Section with embed
As with other areas of wealth, there is a diversity of experiences with higher education and student loans among families from different Asian backgrounds, but significant data gaps impede better analysis of these experiences. Generally, students from lower-income families face more challenges attending and completing college. Affordability is the principal barrier for Native students. Higher debt combined with lower incomes and employment obstacles after graduation are also serious challenges for women—particularly, women of color.
NEA’s report on student loan debt detailed the particularly adverse effects of student loans on educators of color and found that lack of generational wealth contributed to the greater share of Black educators needing loans to finance their education and the higher amounts they needed to borrow.
Additional Resources
Facts: Wealth Inequality in the United States: Inequality.org, Institute for Policy Studies.
Ten Solutions to Bridge the Racial Wealth Divide: Dedrick Asante-Muhammad, Chuck Collins, Darrick Hamilton, and Josh Hoxie.
Boosting Mobility and Advancing Equity through Systems Change. Michael Deich, Martha Fedorowicz, Margery Austin Turner, Urban Institute.
Racial Differences in Economic Security: The Racial Wealth Gap. Benjamin Harris and Sydney Schreiner Wertz, U.S. Department of the Treasury.
What We Get Wrong About Closing the Racial Wealth Gap. William Darity Jr., Darrick Hamilton, Mark Paul, Alan Aja, Anne Price, Antonio Moore, and Caterina Chiopris.
Closing the Racial Inequality Gaps: The Economic Cost of Black Inequality in the U.S. Dana M Peterson and Catherine L Mann.
Chasing the Dream of Equity: How Policy Has Shaped Racial Economic Disparities. Adewale A. Maye, Economic Policy Institute.