Introduction
Understanding the costs associated with housing is integral to financial literacy. Housing is one of the costliest expenses individuals have in their lifetime. The average sales price of houses in the United States has risen from $19,300 in 1963 to $516,500 in 2023. From 2017 to 2021, more than 19 million renters in the United States “spent more than 30 percent of their income on housing costs”—an amount that exceeded the U.S. Department of Housing and Urban Development’s definition of affordable housing.
The National Standards in Personal Finance Education, published by the Council for Economic Education and Jump$tart Coalition for Personal Financial Literacy, is “a framework for a complete personal finance curriculum that progresses through elementary, middle, and high school to prepare students for their lives as smart consumers.” Housing is one of many important topics discussed throughout this influential framework.
Because financial literacy includes homeownership, mortgages, and renting, it is crucial that students learn about the historical and contemporary injustices in housing. Housing injustice has been a persistent and economically devastating problem in the United States for generations. The effects of residential segregation, redlining, income inequality, and lending discrimination have had a lasting legacy on Native Peoples, People of Color, women, and LGBTQ+ individuals. Although not comprehensive, this page provides data on housing injustice in the United States.
Homeownership and Mortgage Rates
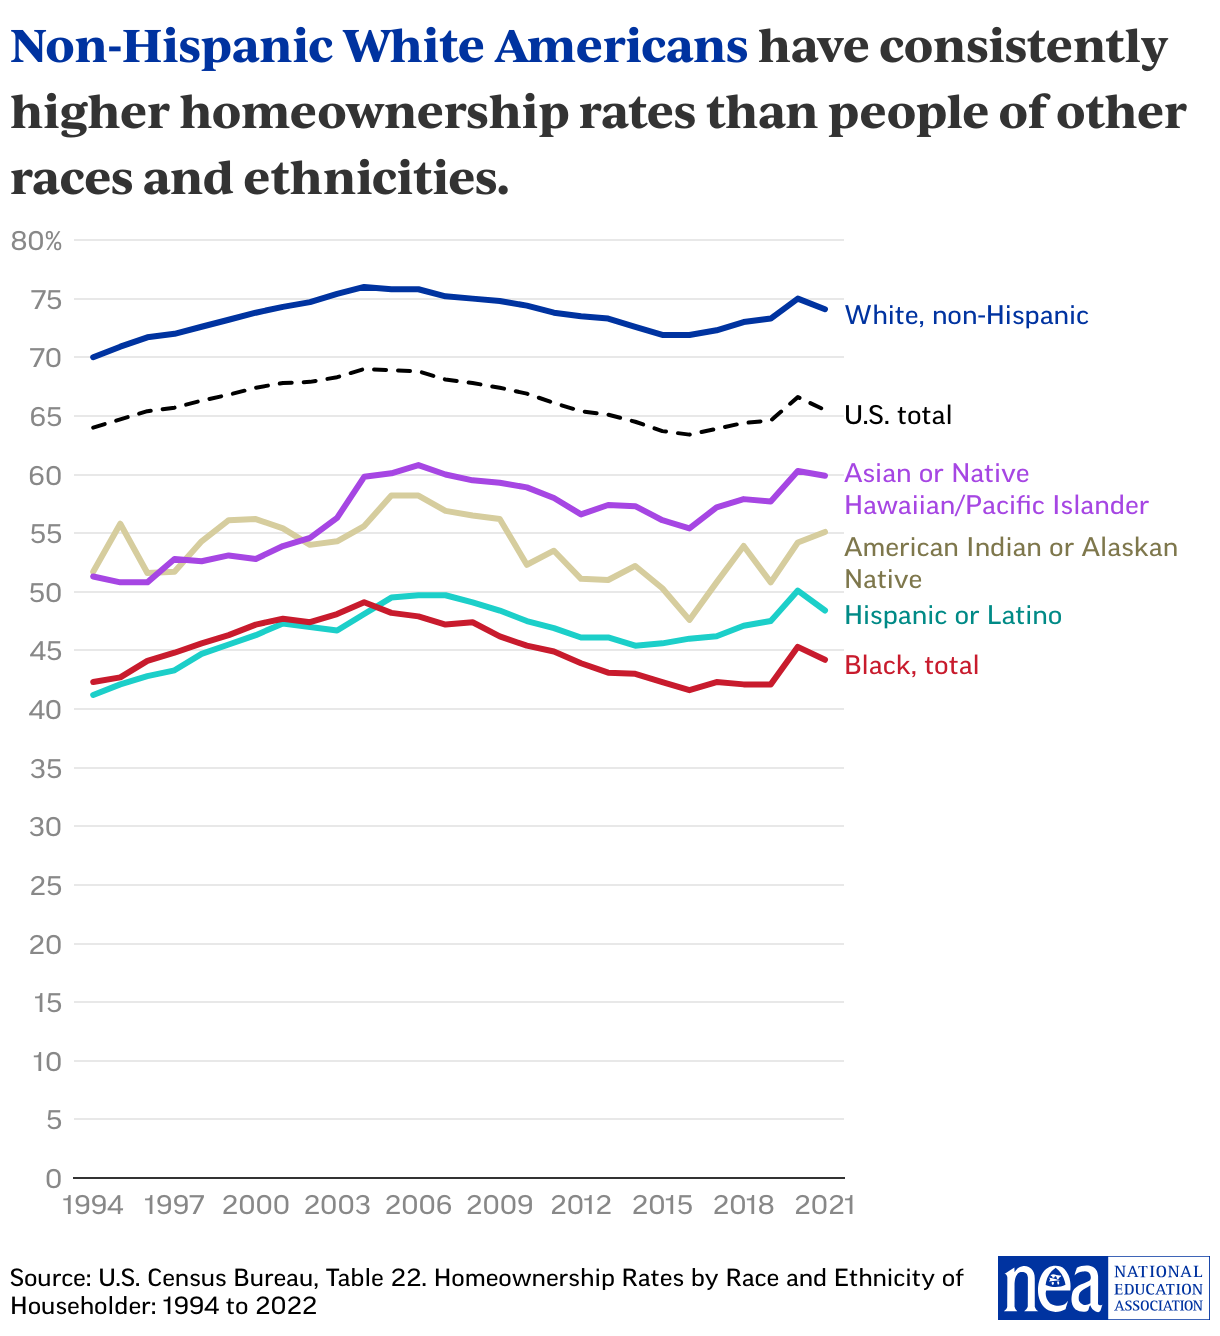
The graphs in this section provide demographic data on the disparities in homeownership and acquiring mortgages in the United States.
- Since 1994, non-Hispanic White Americans have consistently had greater homeownership rates than any other race/ethnicity.
- During the same period Black and Hispanic or Latin(o/a/x) Americans had the lowest homeownership rate compared to all other race/ethnicity groups.
Section with embed
Taking a closer look at the rates of change between men and women regarding homeownership:
- From 1990 to 2021, the gender homeownership gap between men and women decreased by 15 percentage points to only 5 points, largely due an increase in homeownership among women. Homeownership among men decreased slightly.
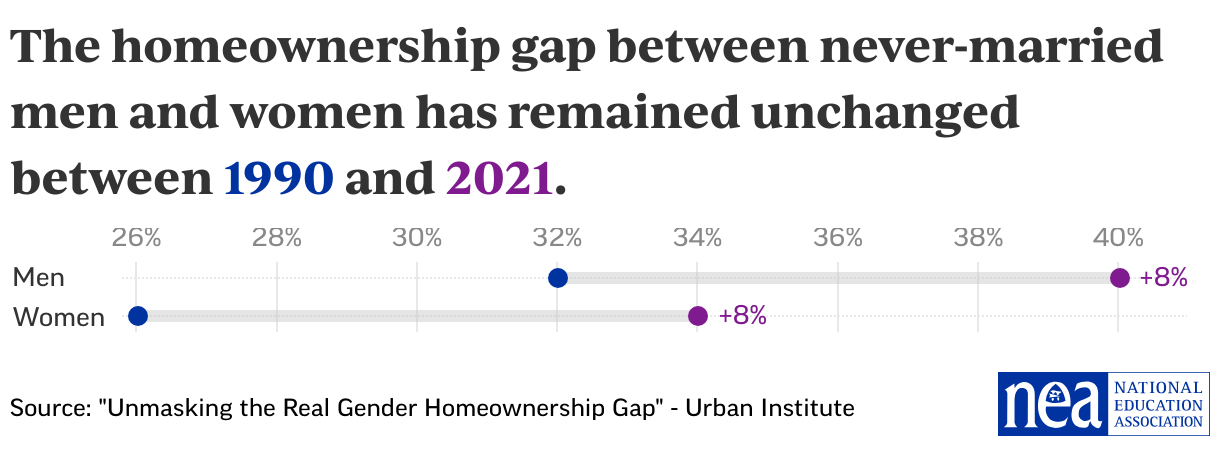
However, a large gender gap persists when considering never-married men and women.
- While homeownership among never-married women increased by 8 percentage points from 1990 to 2021, the same increase occurred for never-married men, leaving the gap unchanged at 6 percentage points.
Section with embed
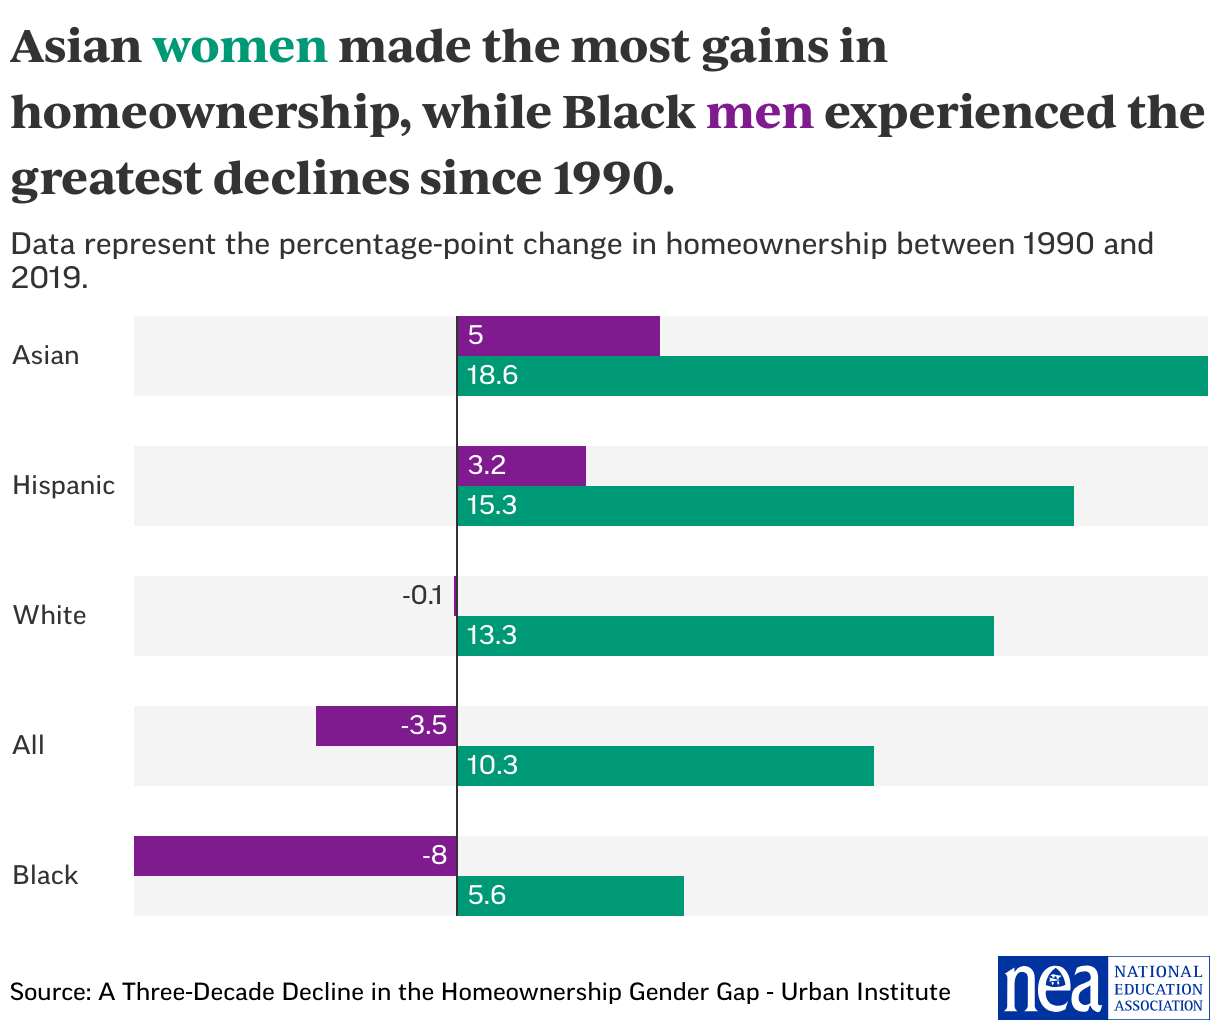
Although women’s homeownership increased overall, there are still persistent gaps when looking at racial and ethnic differences:
- Between 1990 and 2019, women’s overall homeownership increased by 10.3 percentage points while men’s homeownership decreased by 3.5 percentage points.
- Hispanic (15.3 percentage points) and Asian American women (18.6 percentage points) experienced the largest increase in homeownership among women between 1990 and 2019.
- During the same period, Black men experienced the largest drop (8 percentage points) in homeownership, while Black women increased by 5.6 percentage points.
Section with embed
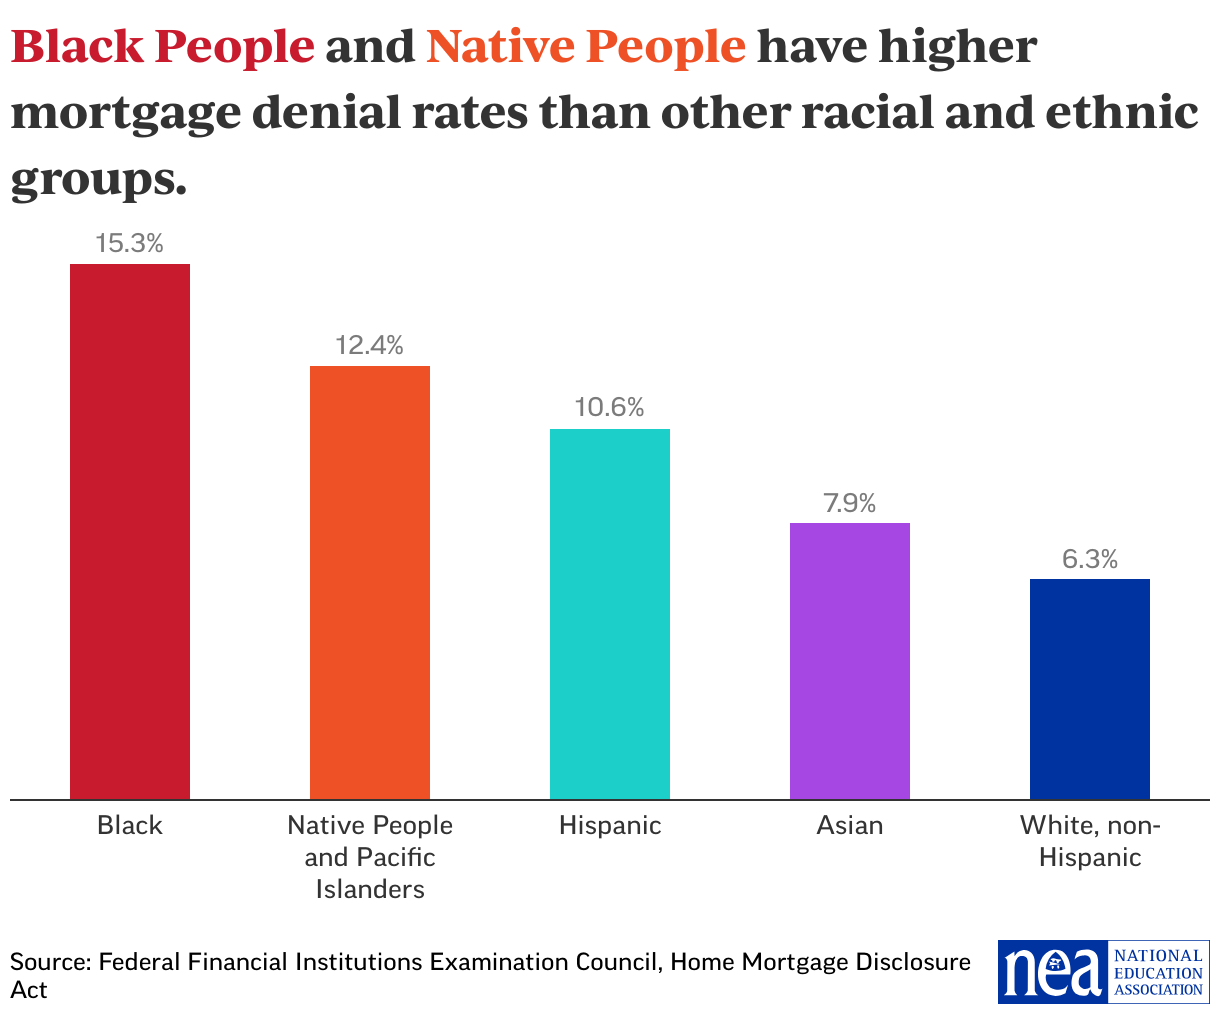
Other than homeownership, a gap in mortgage lending also exists in the United States:
- The overall mortgage denial rate for 2021 was 8.3 percent, down from 9.3 percent in 2020.
- However, this statistic obscures the fact that Black, Hispanic, and Native People had much higher denial rates than Asian and White Americans in 2021. The mortgage denial rate for Black Americans was greater than 15 percent in every year from 2018 to 2021.
Section with embed
Renting Rates
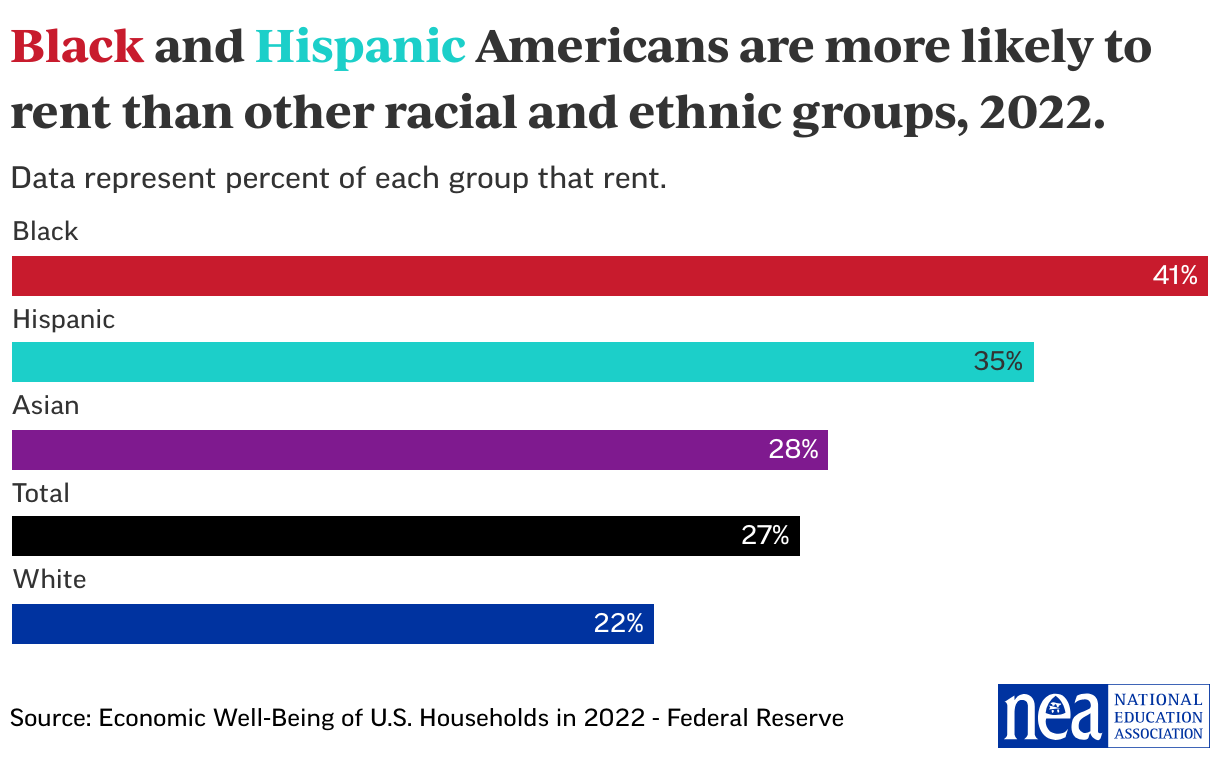
The graphs in this section provide demographic data related to renting homes in the United States.
- Approximately 27 percent of all adults in the United States rented their home in 2022.
- Black (41 percent) and Hispanic (35 percent) Americans rent at a higher rate than the national average.
Section with embed
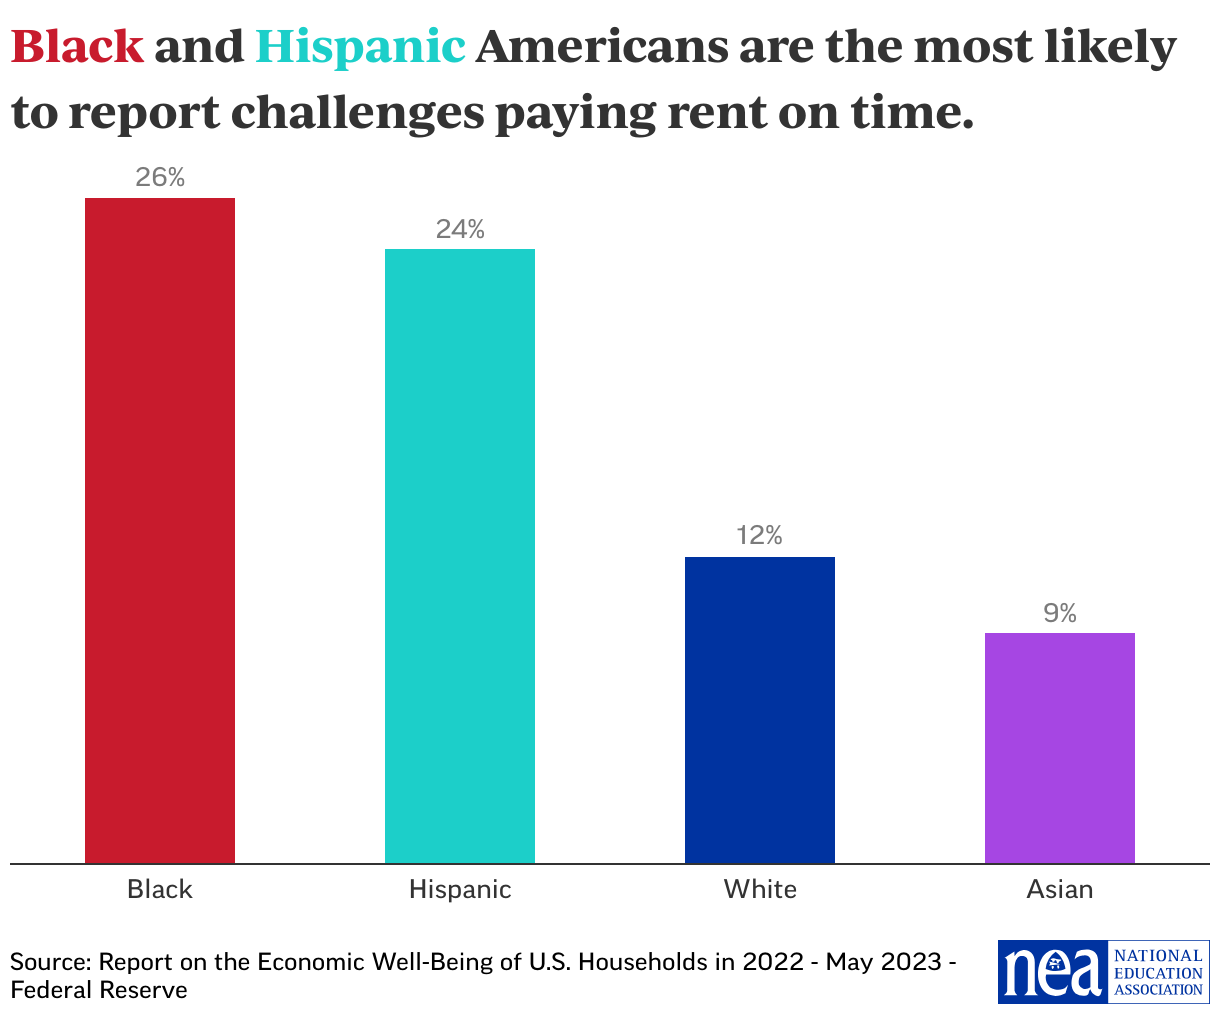
Many Americans have difficulties affording their rent from month-to-month.
- Approximately 17% of all renters reported having difficulties paying their rent on time in 2022.
- Black and Hispanic Americans reported having more challenges in paying rent on time compared to Asian and White Americans, with Black renters and Hispanic renters twice as likely or more than White or Asian renters to report difficulties in paying rent on time.
Section with embed
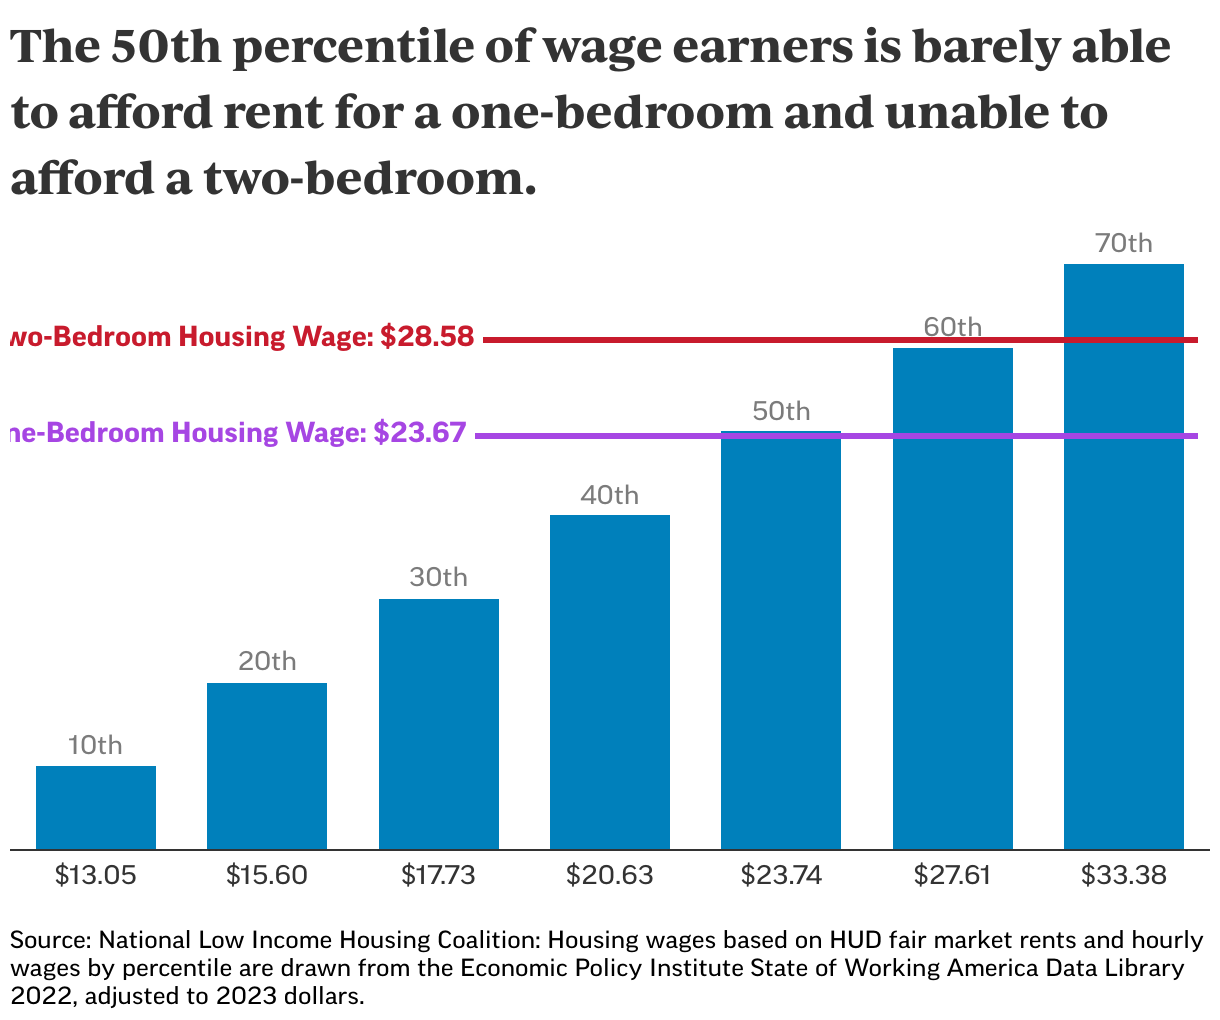
Rental rates are unattainable for many wage-earning Americans.
- Almost half of all wage earners in 2023 are unable to afford the rent for a one-bedroom home from a single full-time job, while over 60 percent of all wage earners in 2023 are unable to afford the rent for a two-bedroom home from a single full-time job.
Section with embed
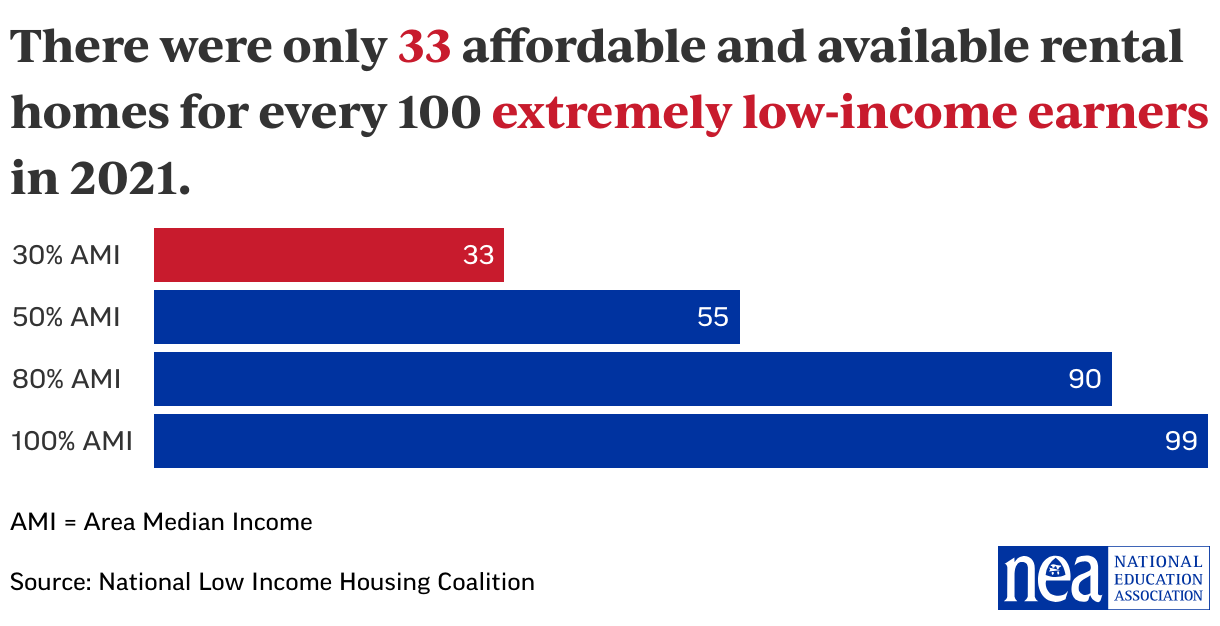
A significant gap in affordable and available rental housing exists between income earners in the Unted States.
- According to the National Low Income Housing Coalition, extremely low-income renters face a shortage of 7.3 million homes. For this group, there are only 33 affordable homes available for every 100 renter households compared to 99 available for every 100 households at the area median income.
Section with embed
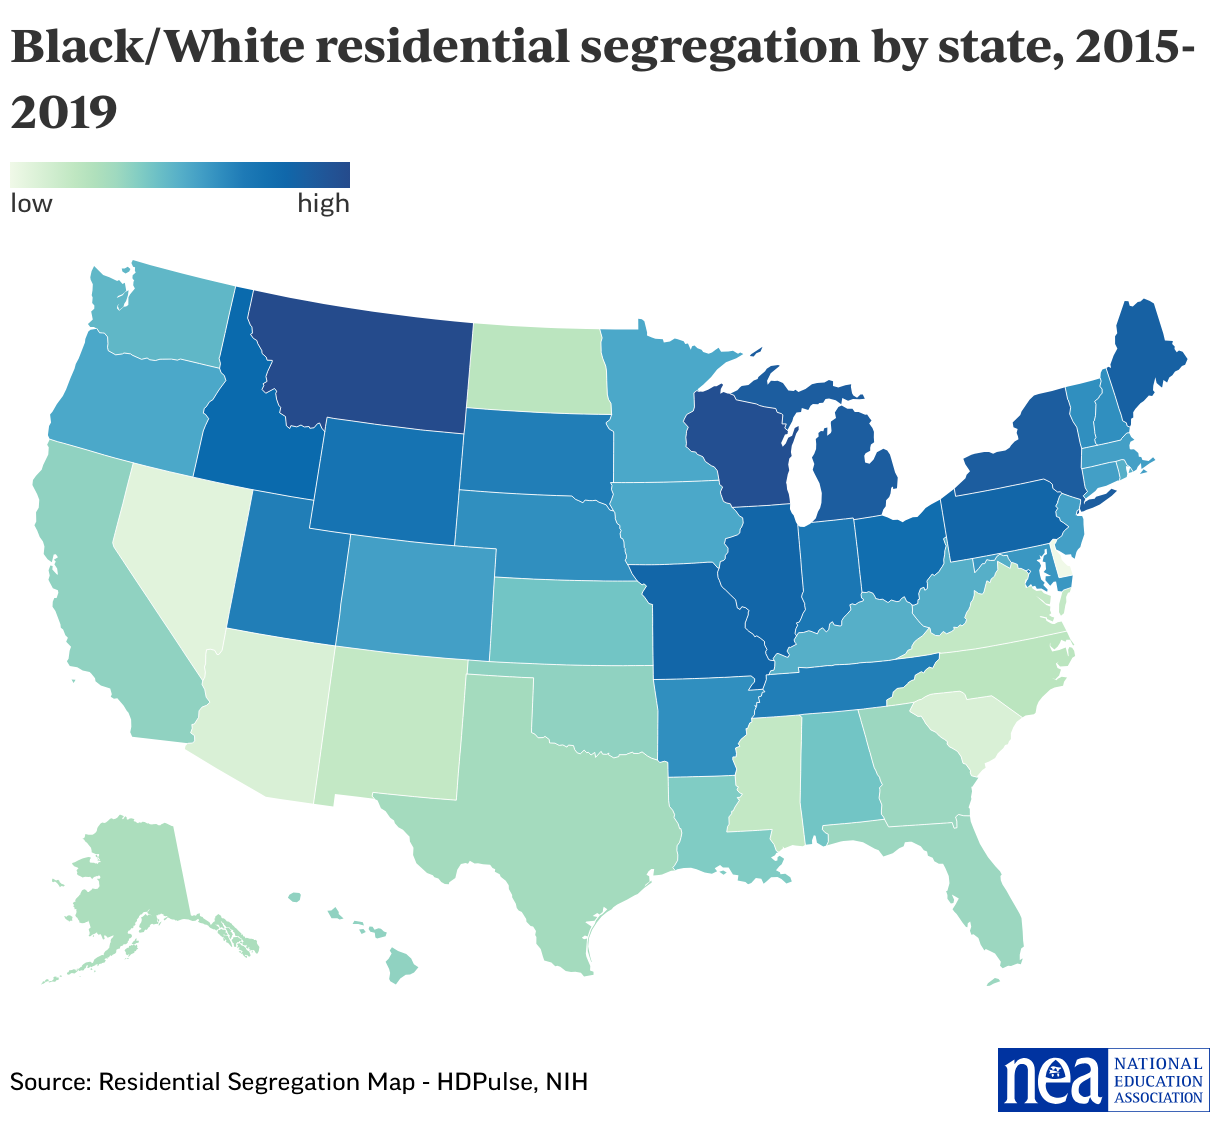
Residential Segregation
Racial/ethnic residential segregation refers to the degree to which two or more groups live separately from one another in a geographic area. The heat map below uses data from the National Institutes of Health to show the distribution of Black and White residents in each state. The map ranges from 0 (complete integration) to 100 (complete segregation). Southern and Southwestern states have lower levels of segregation, while states in the Mountain West and Midwest, and Mid Atlantic have the highest rates.
Section with embed